TOcore
As part of my work on the City of Toronto TOcore Project at the Canadian Urban Institute, the following maps and graphs were created for the Neighbourhood Population Profile Report, released August 2016. The Maps were laid out and styled in ESRI ArcMap, with custom legends created in Adobe Illustrator. Tables were created in Excel.
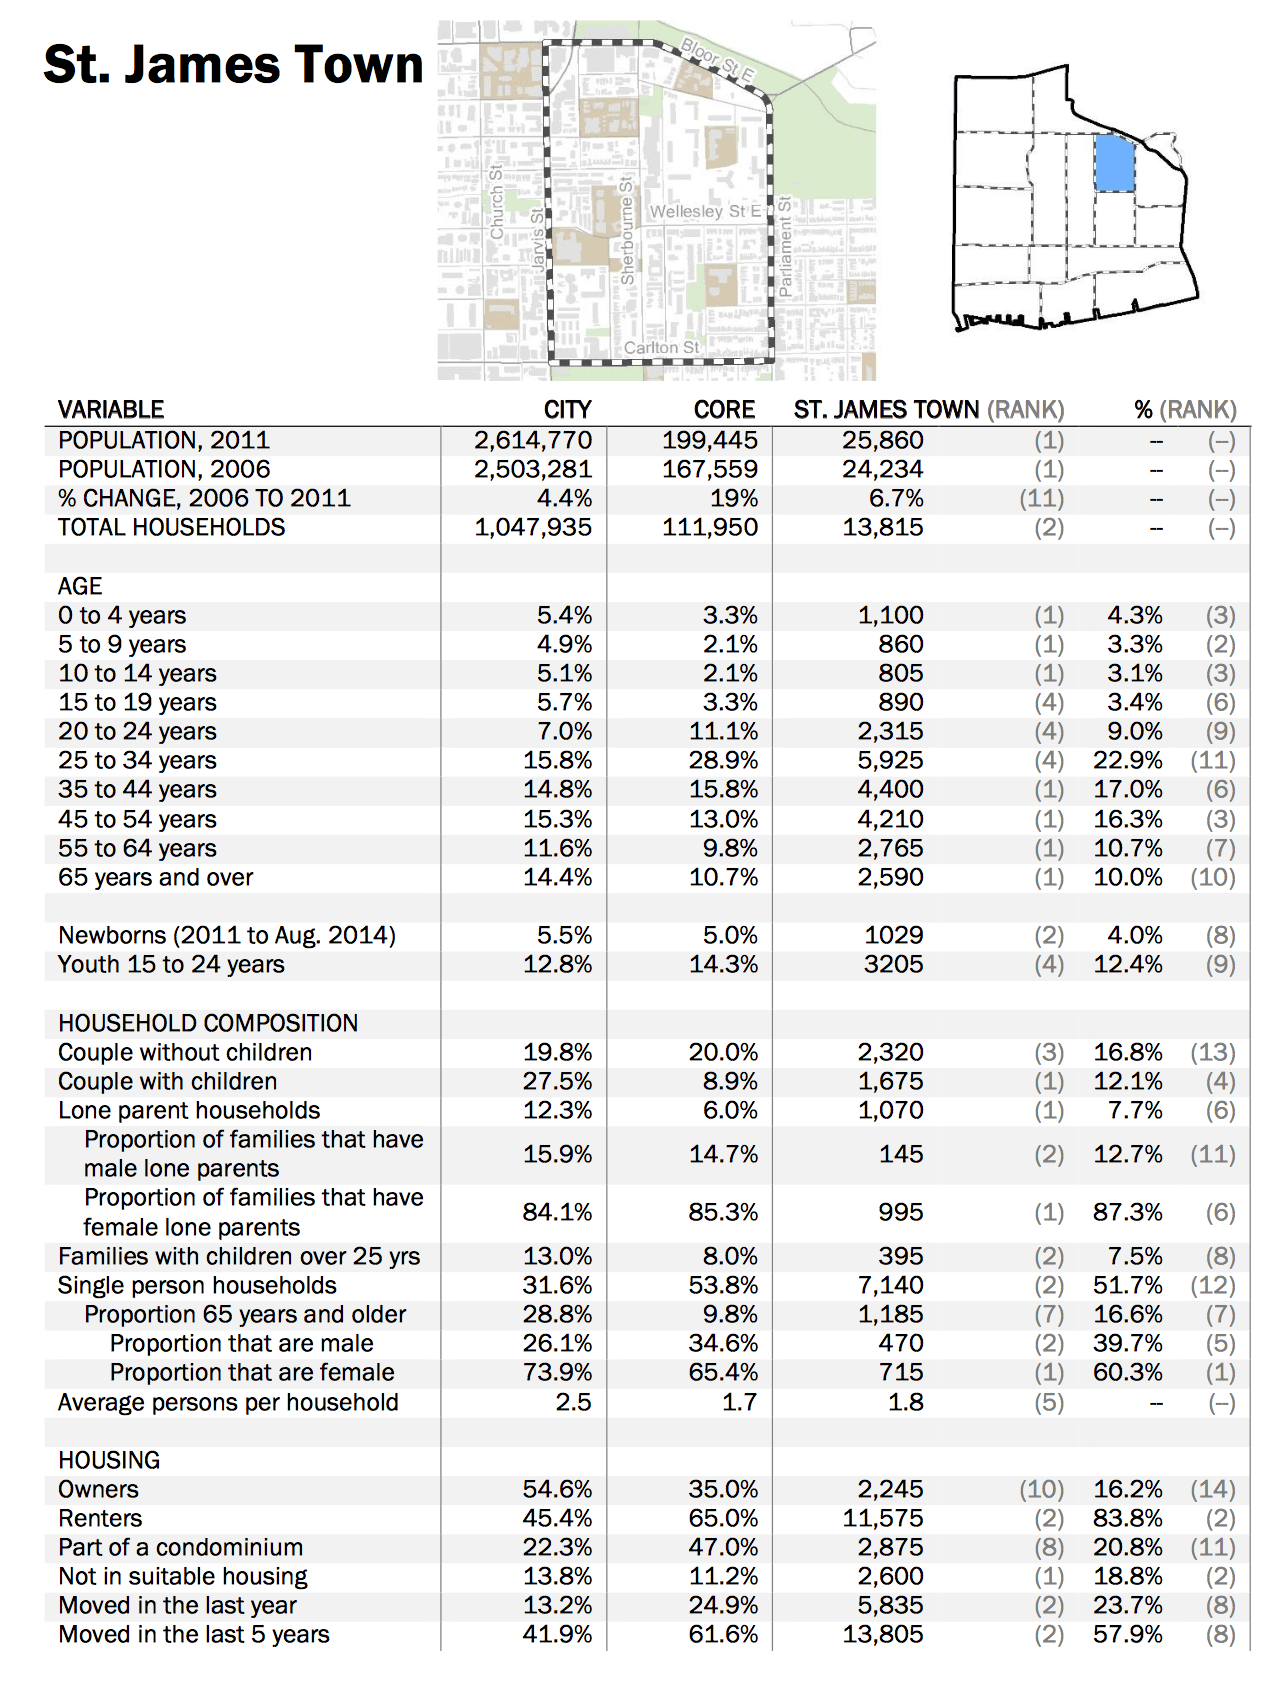
The report presents population profiles for the 16 TOcore neighbourhoods constructed using the most recently available data from Statistics Canada’s 2006 and 2011 Census of Canada, 2011 National Household Survey (NHS), and IntelliHEALTH ONTARIO.
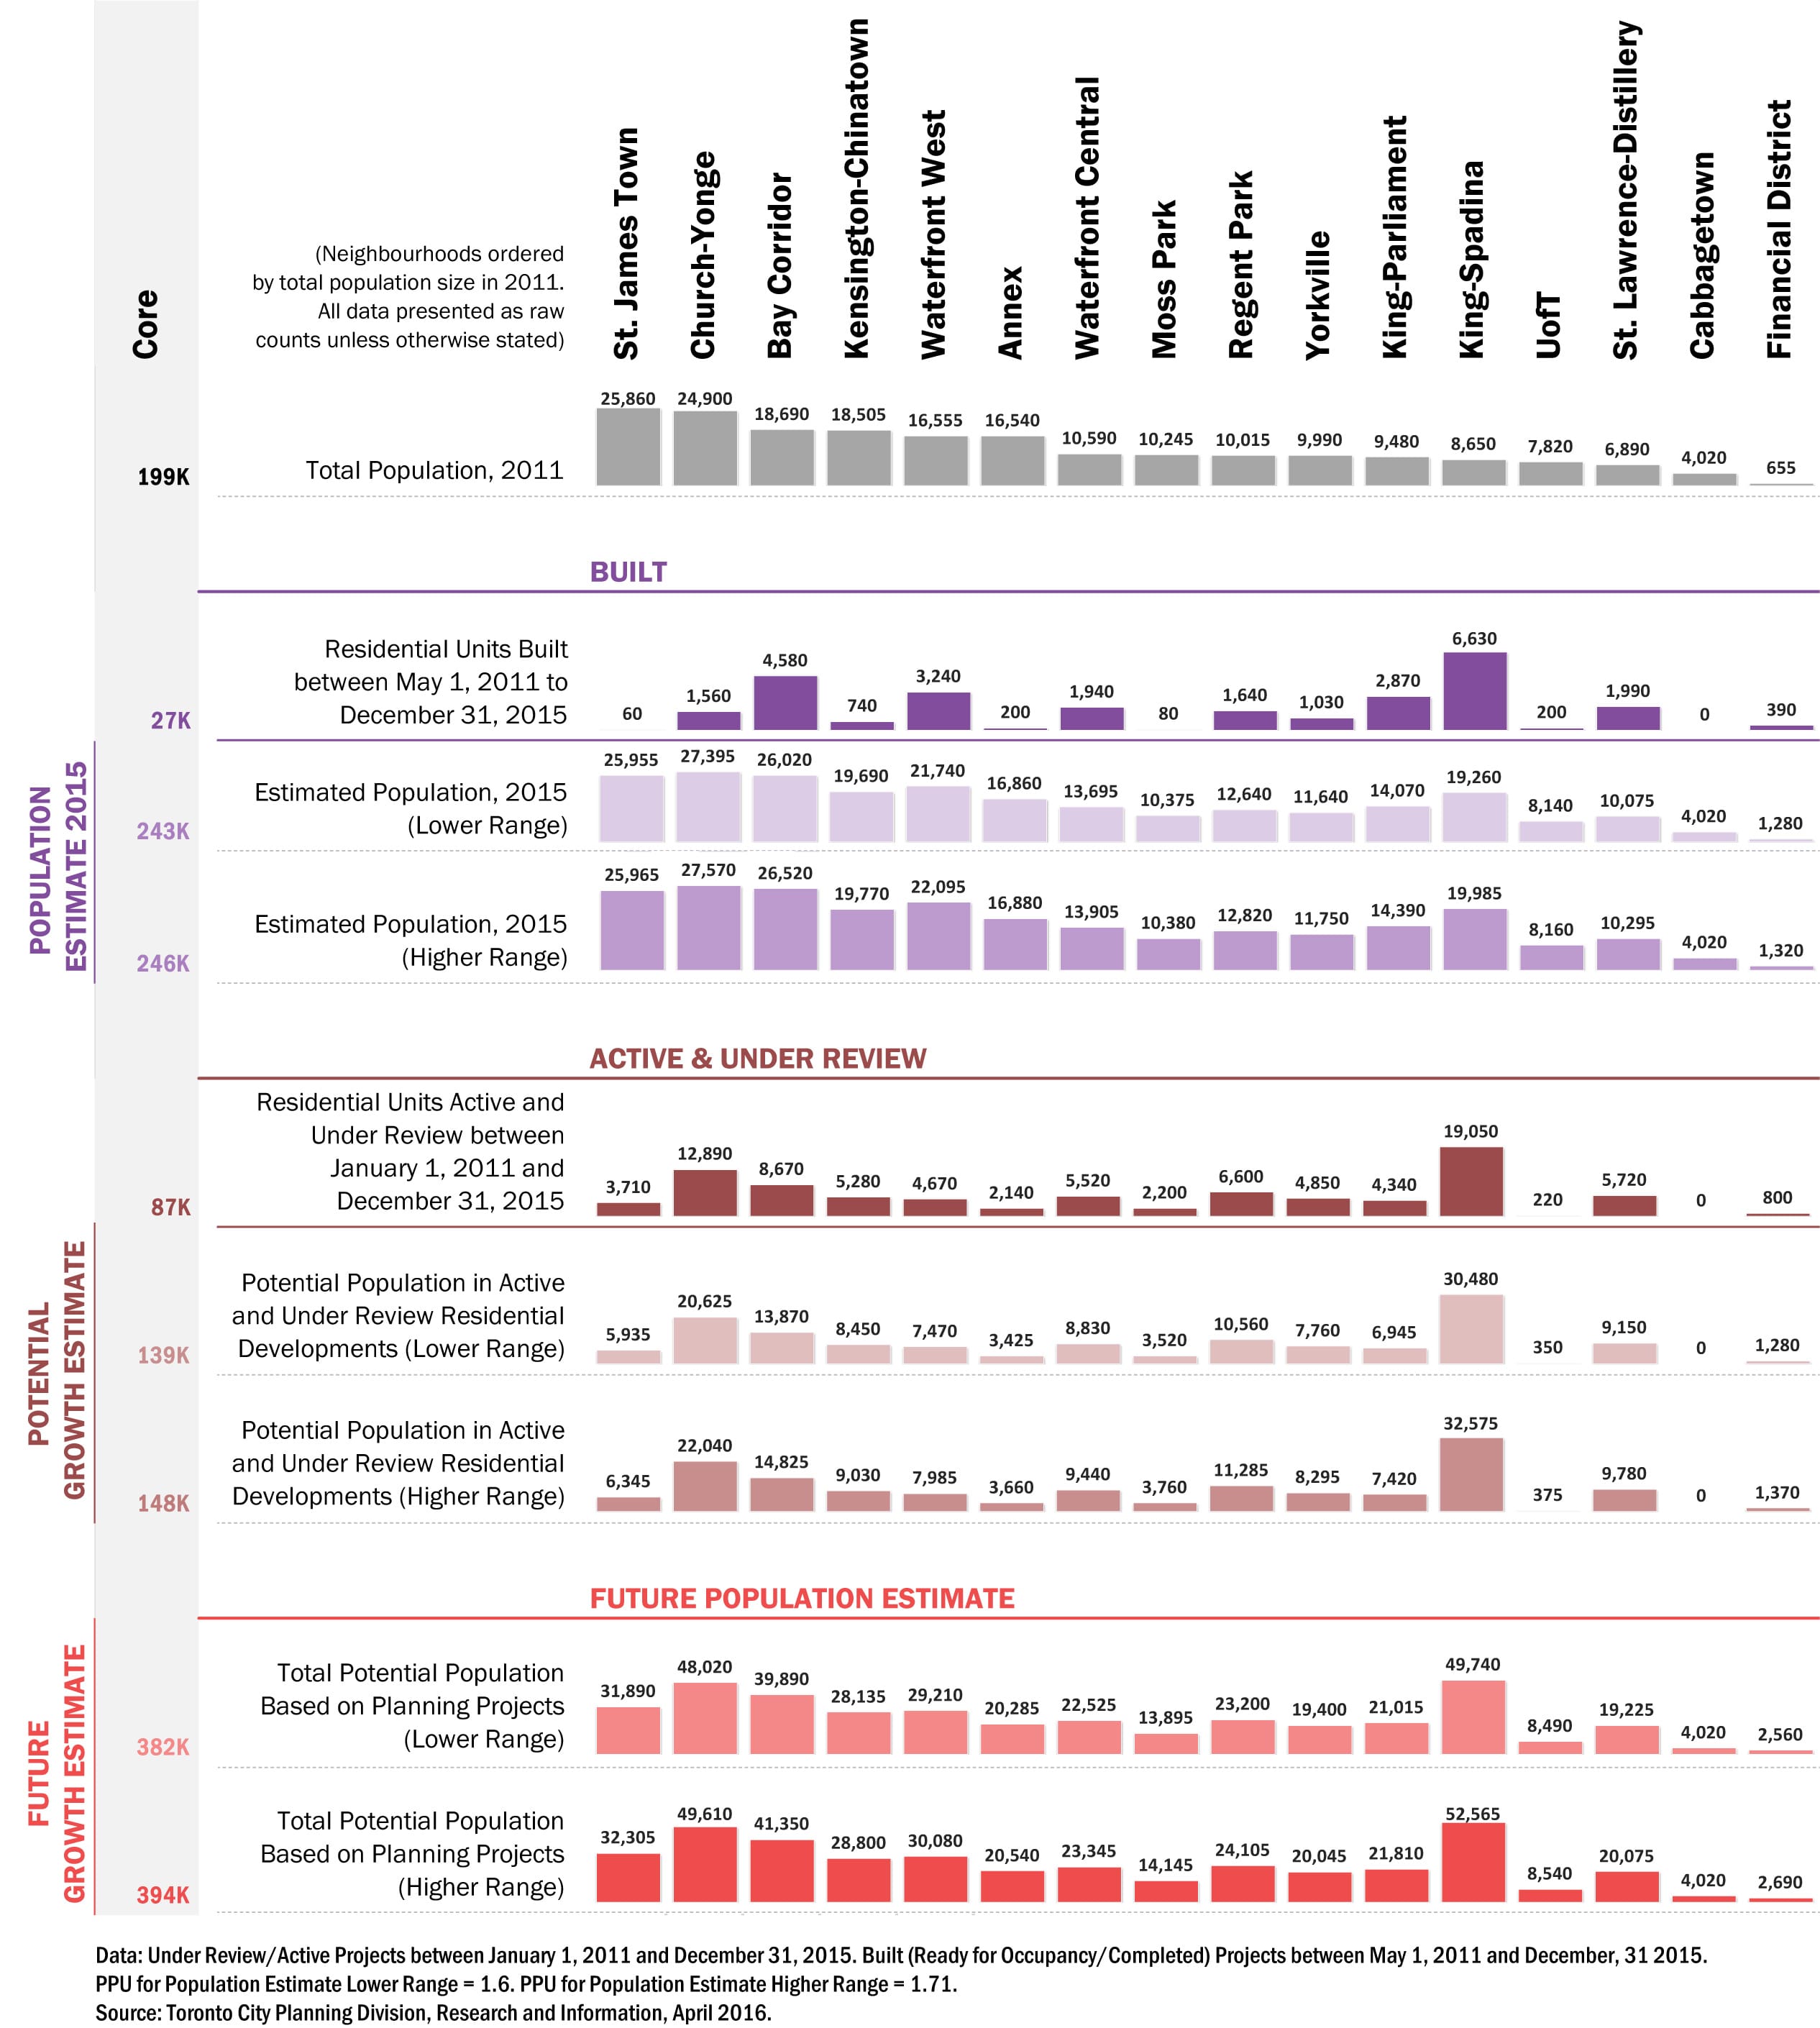
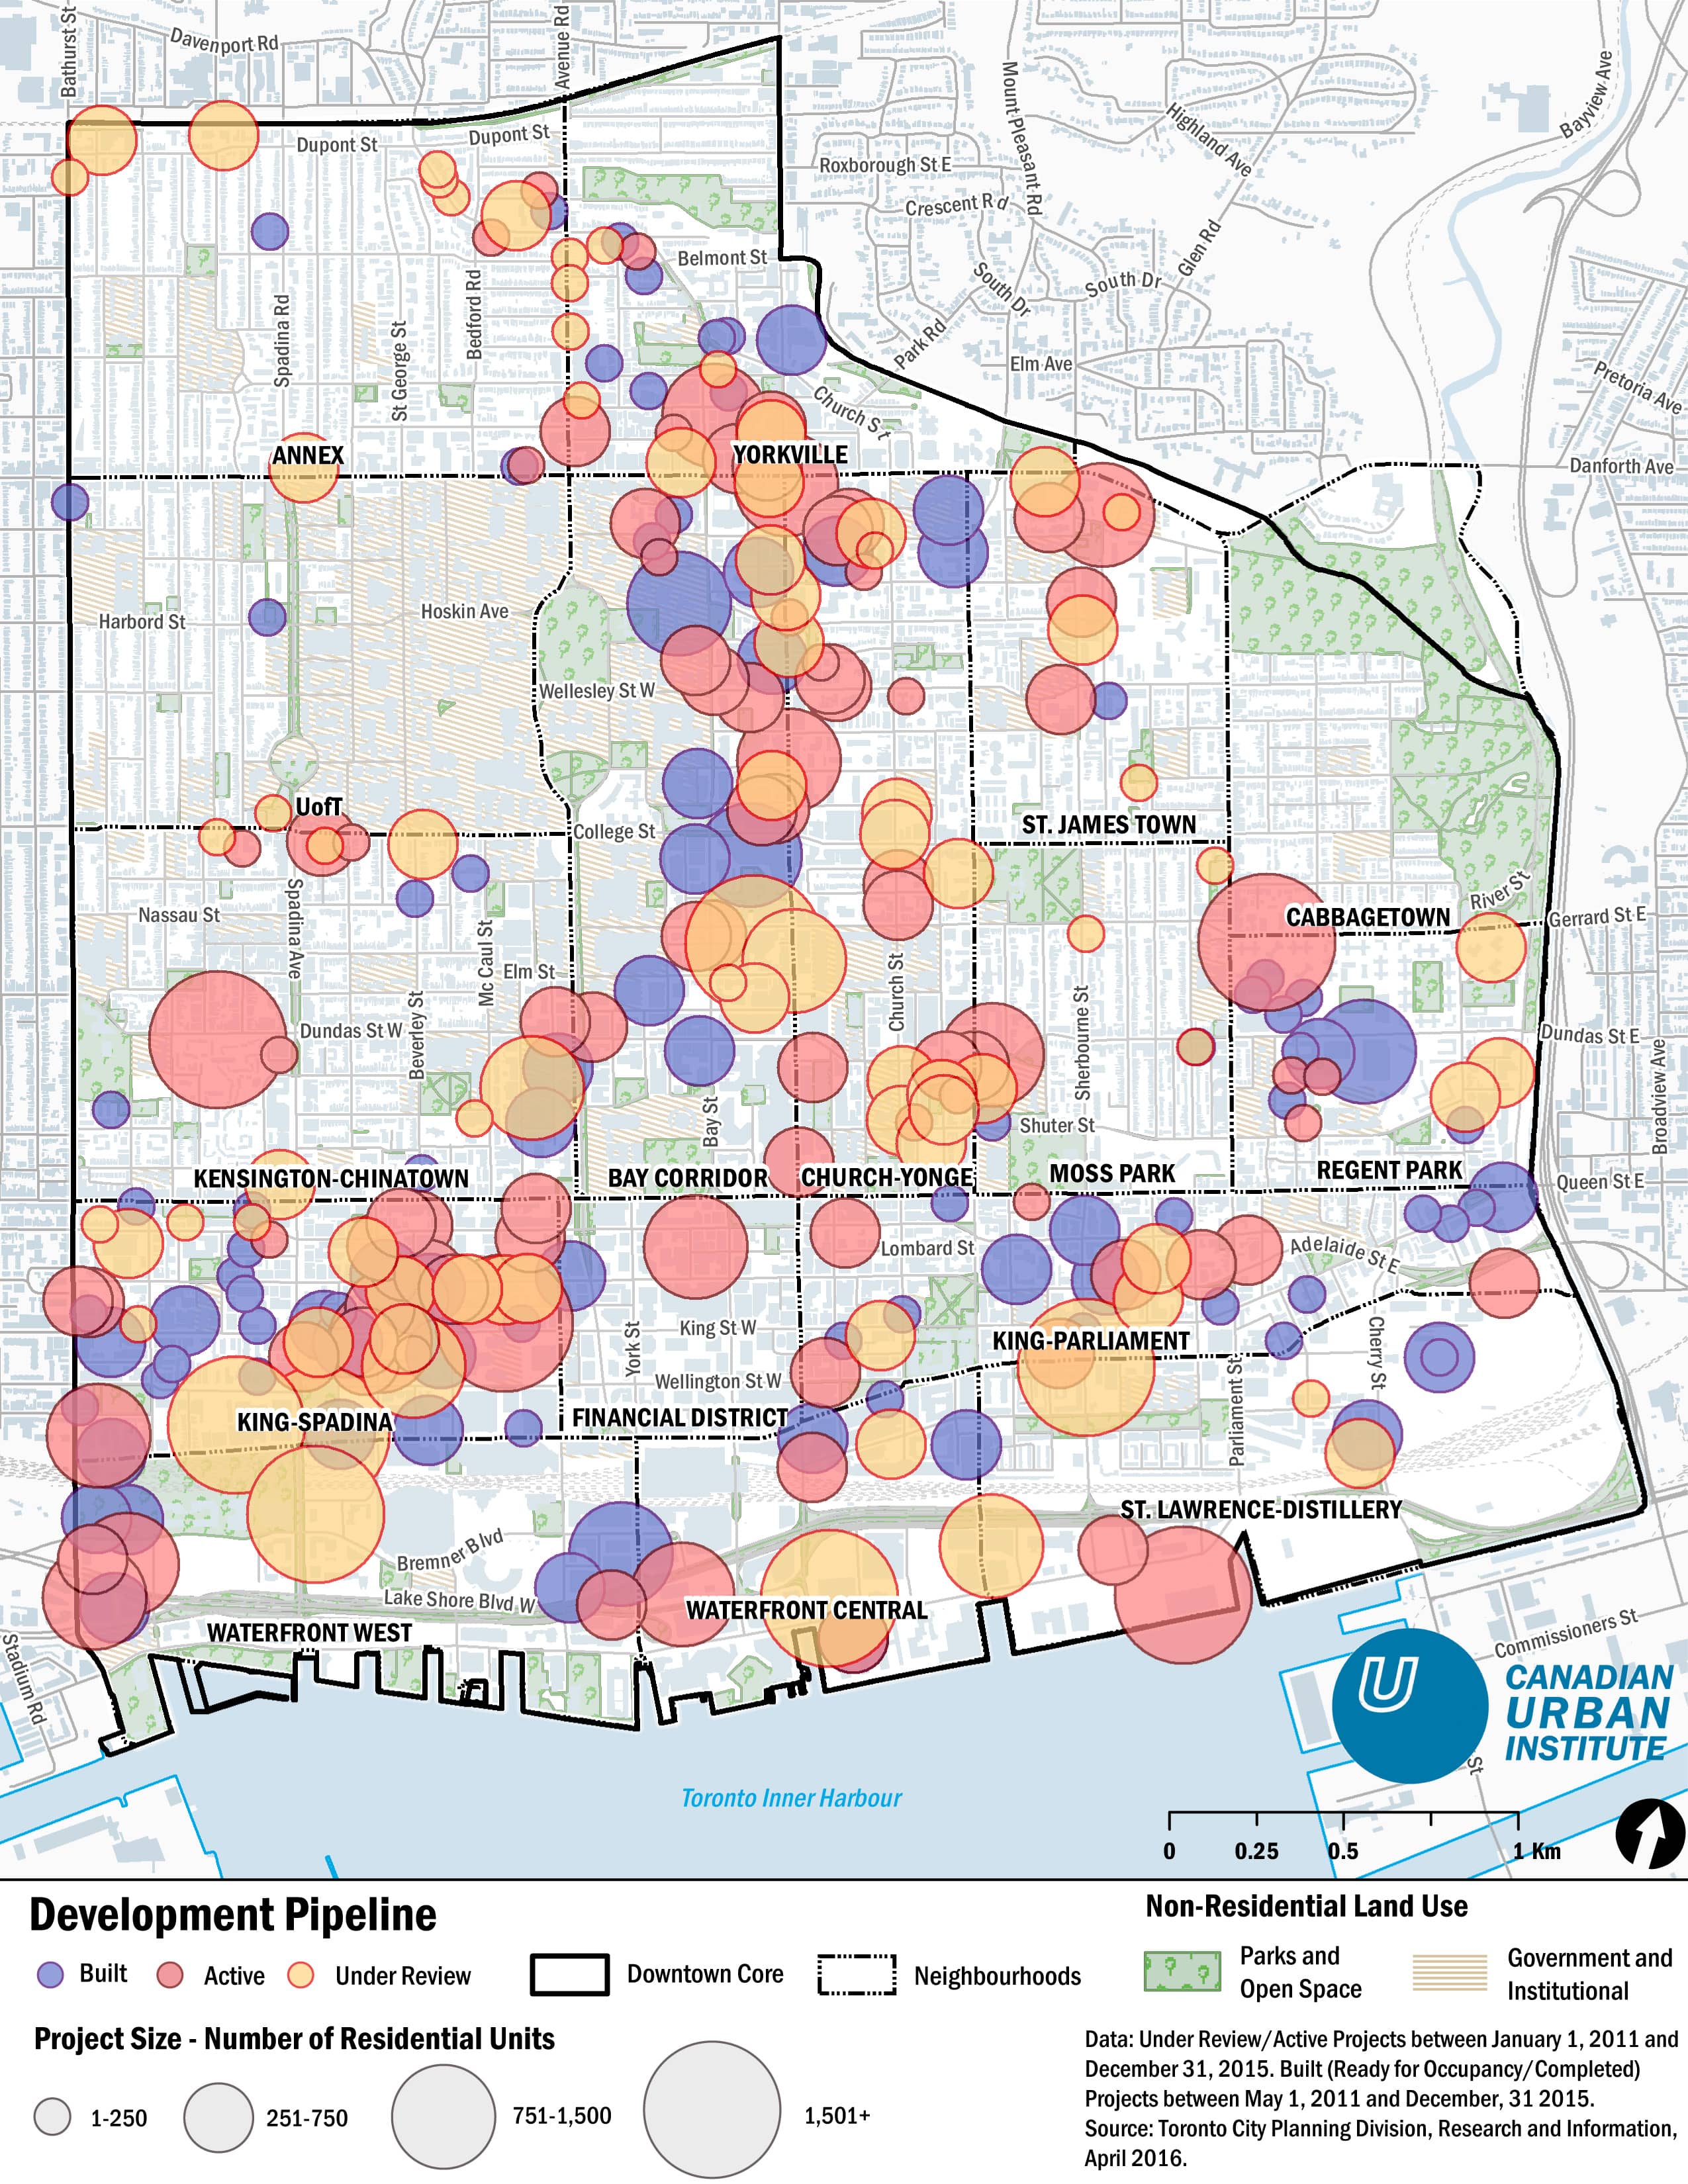
In the absence of any more recent data than the 2011 Census, potential growth in the downtown has been calculated for the 16 TOcore neighbourhoods using Development Pipeline data provided by City Planning at the City of Toronto. The Development Pipeline data consists of all built, active, and under review residenital projects over a five-year timeframe, 2011 to 2015. Data for built projects is provided between May 1, 2011 and December 31, 2015, while data for active and under review projects reflects projects between January 1, 2011 and December 31, 2015.
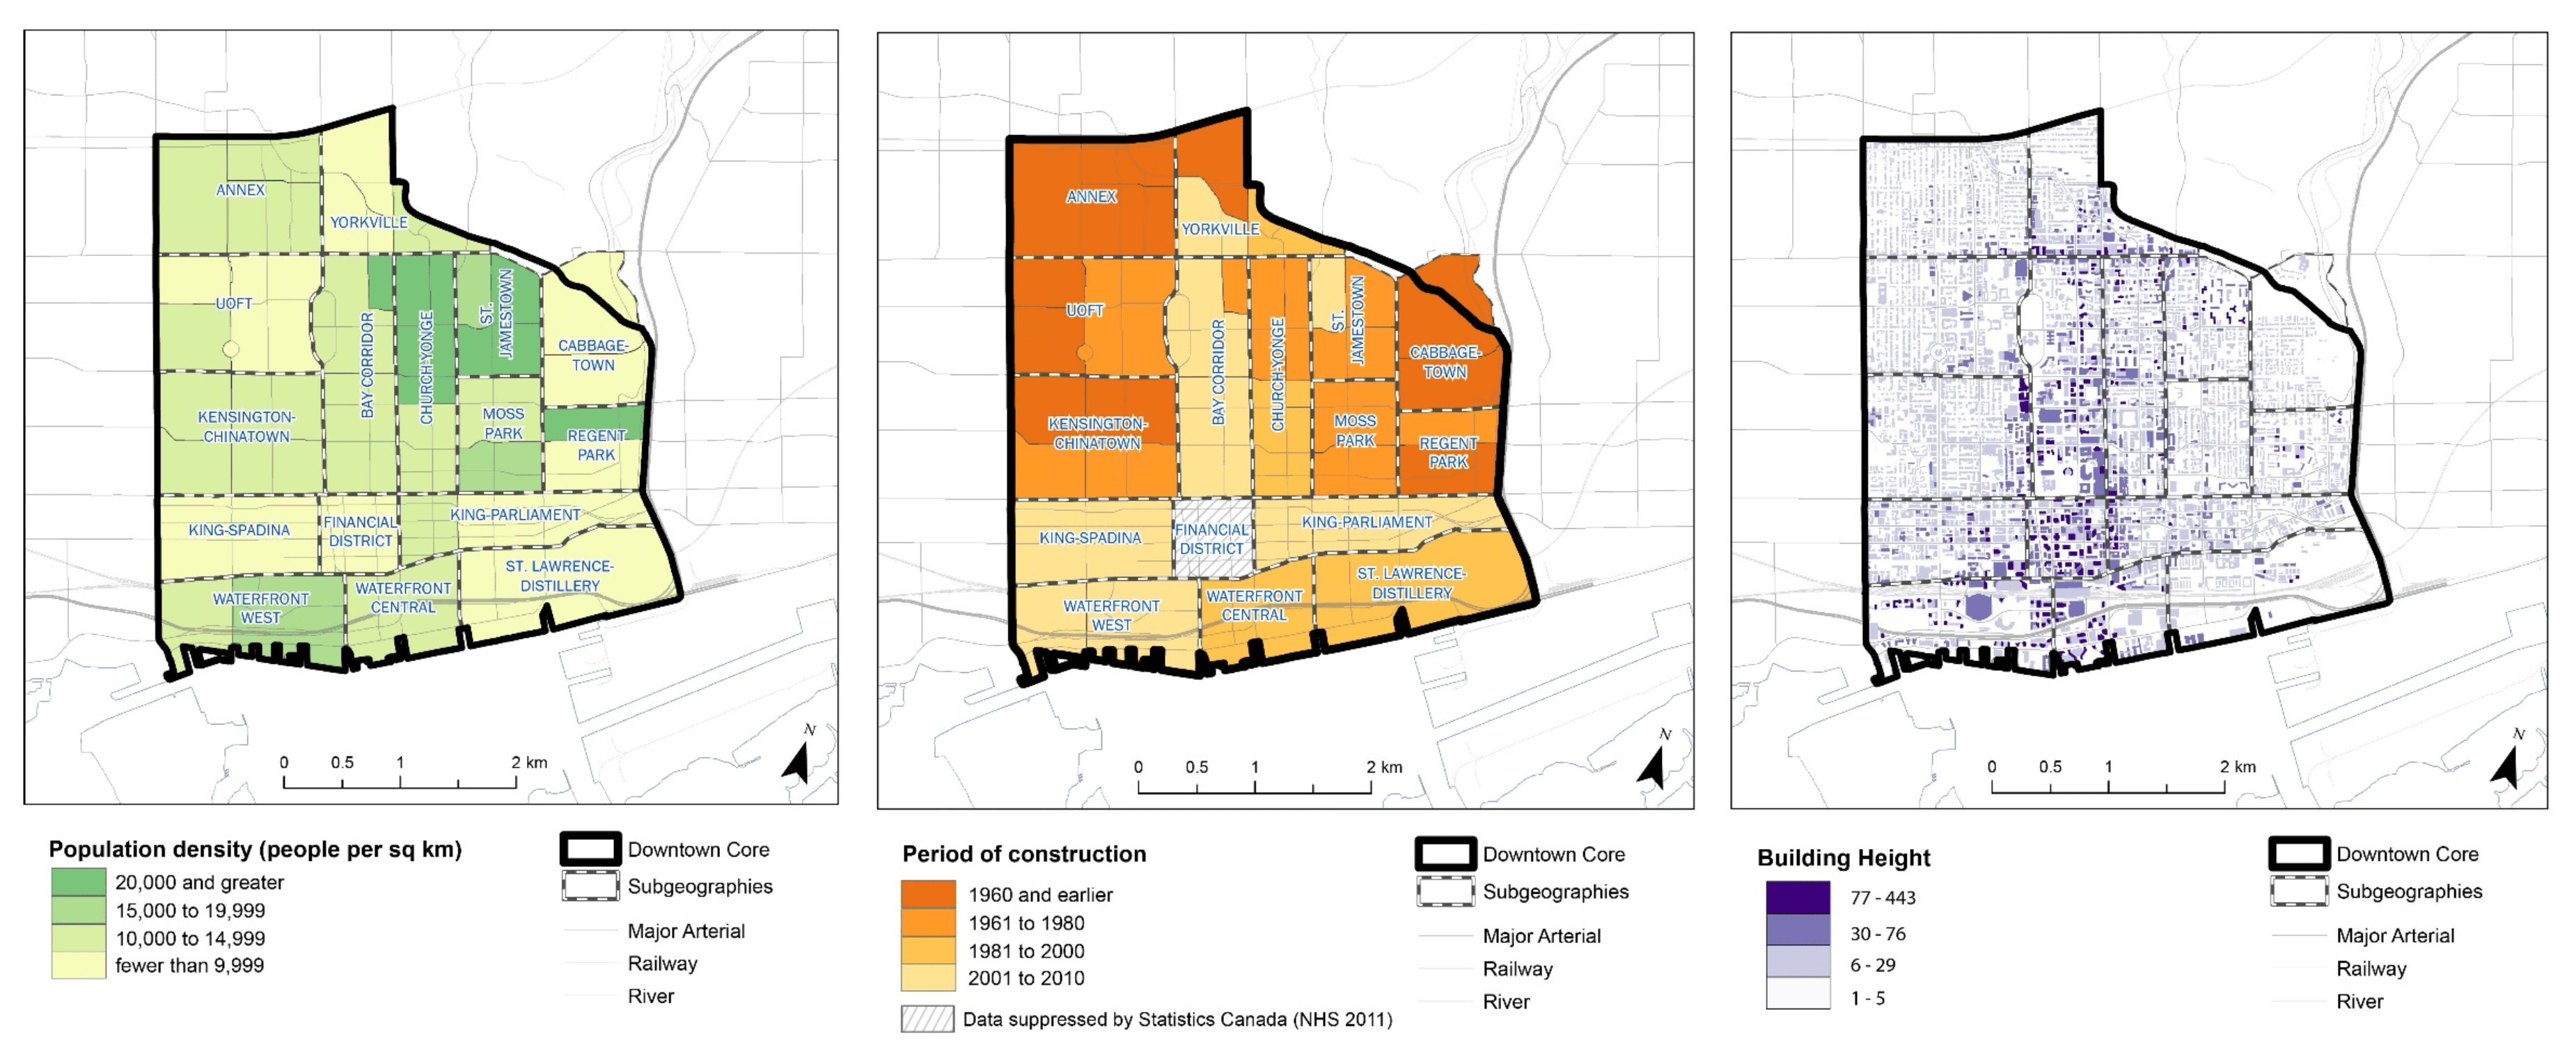
Neighbourhood Population Profiles and Maps
Development Pipeline - Project Size, Number of Residential Units
Population Estimate Percentage Increase Based on Development Pipeline
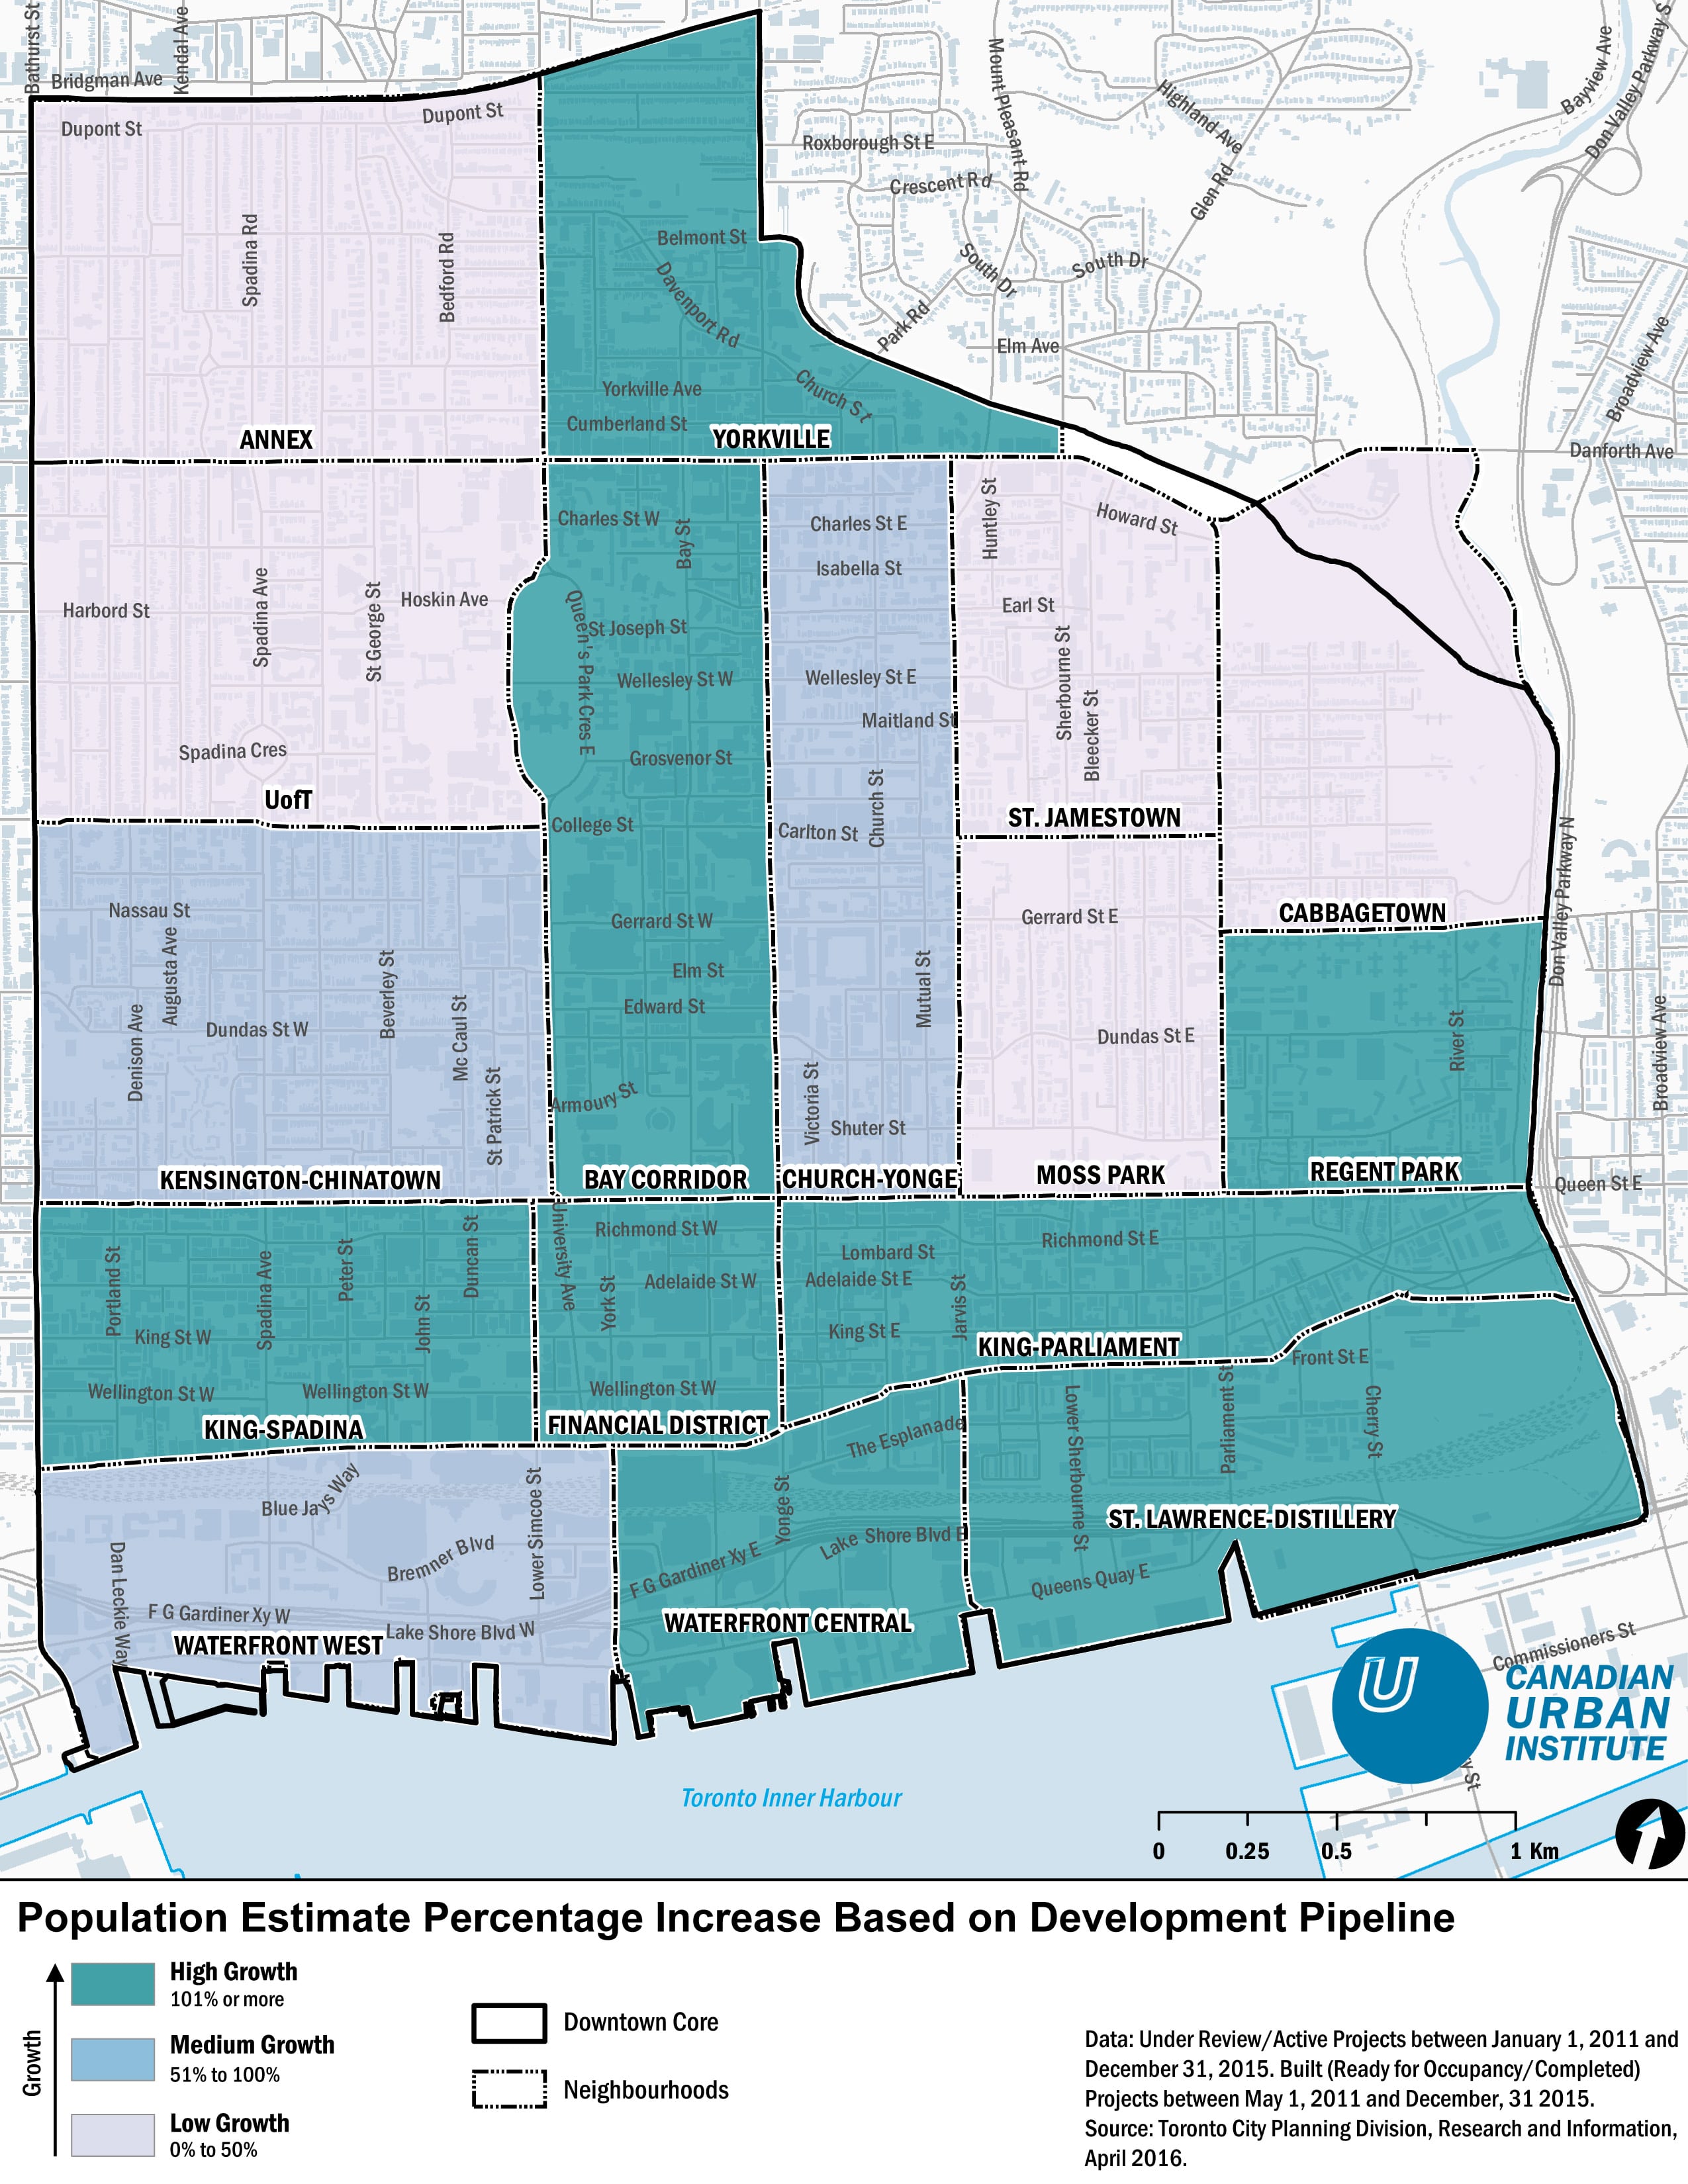
Potential Growth in the Downtown by Neighbourhood