Historical Atlas of Canada Population by Census Divisions 1851-1961 Web-mapping Pilot Project
The following interactive web maps were created as part of my work with Canadian Historical Geographic Information Systems Partnership as part of a pilot project to update Historical Atlas of Canada Population by Census Divisions 1851-1961 web maps using open source tools and services. The three maps were created using the Mapbox GL API, data driven styling and legends and jQuery to filter layers based on year.
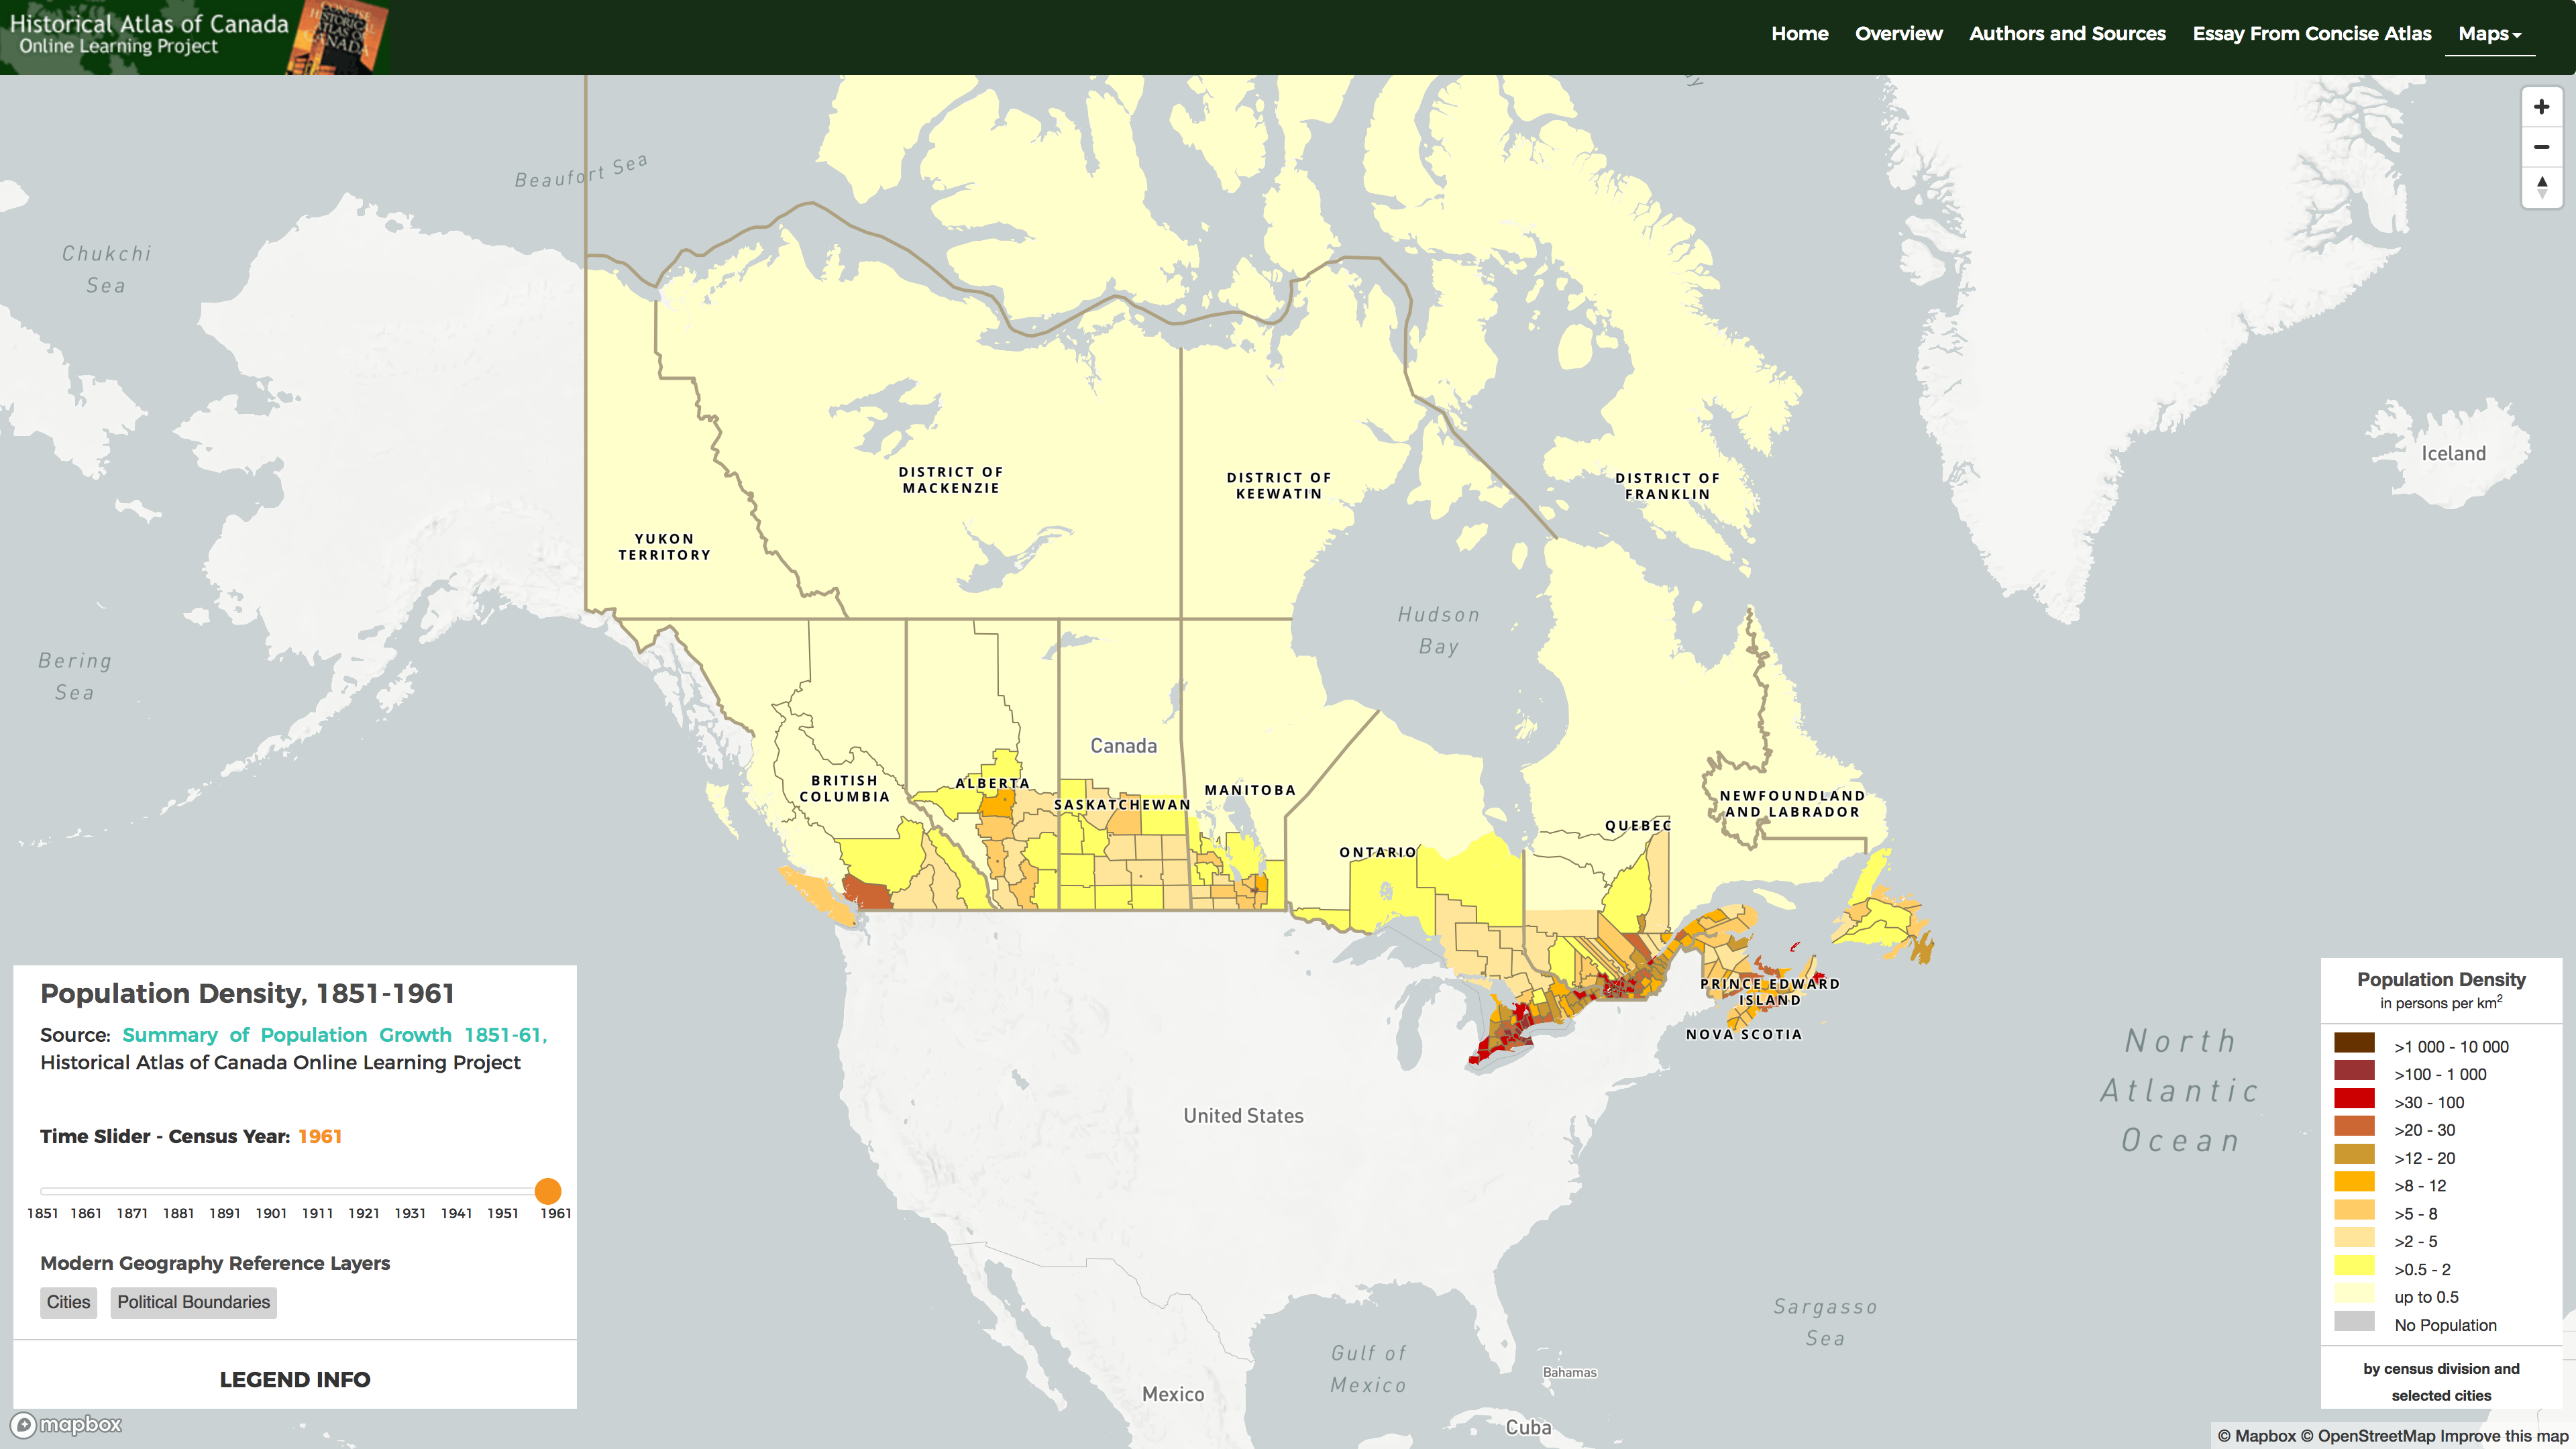
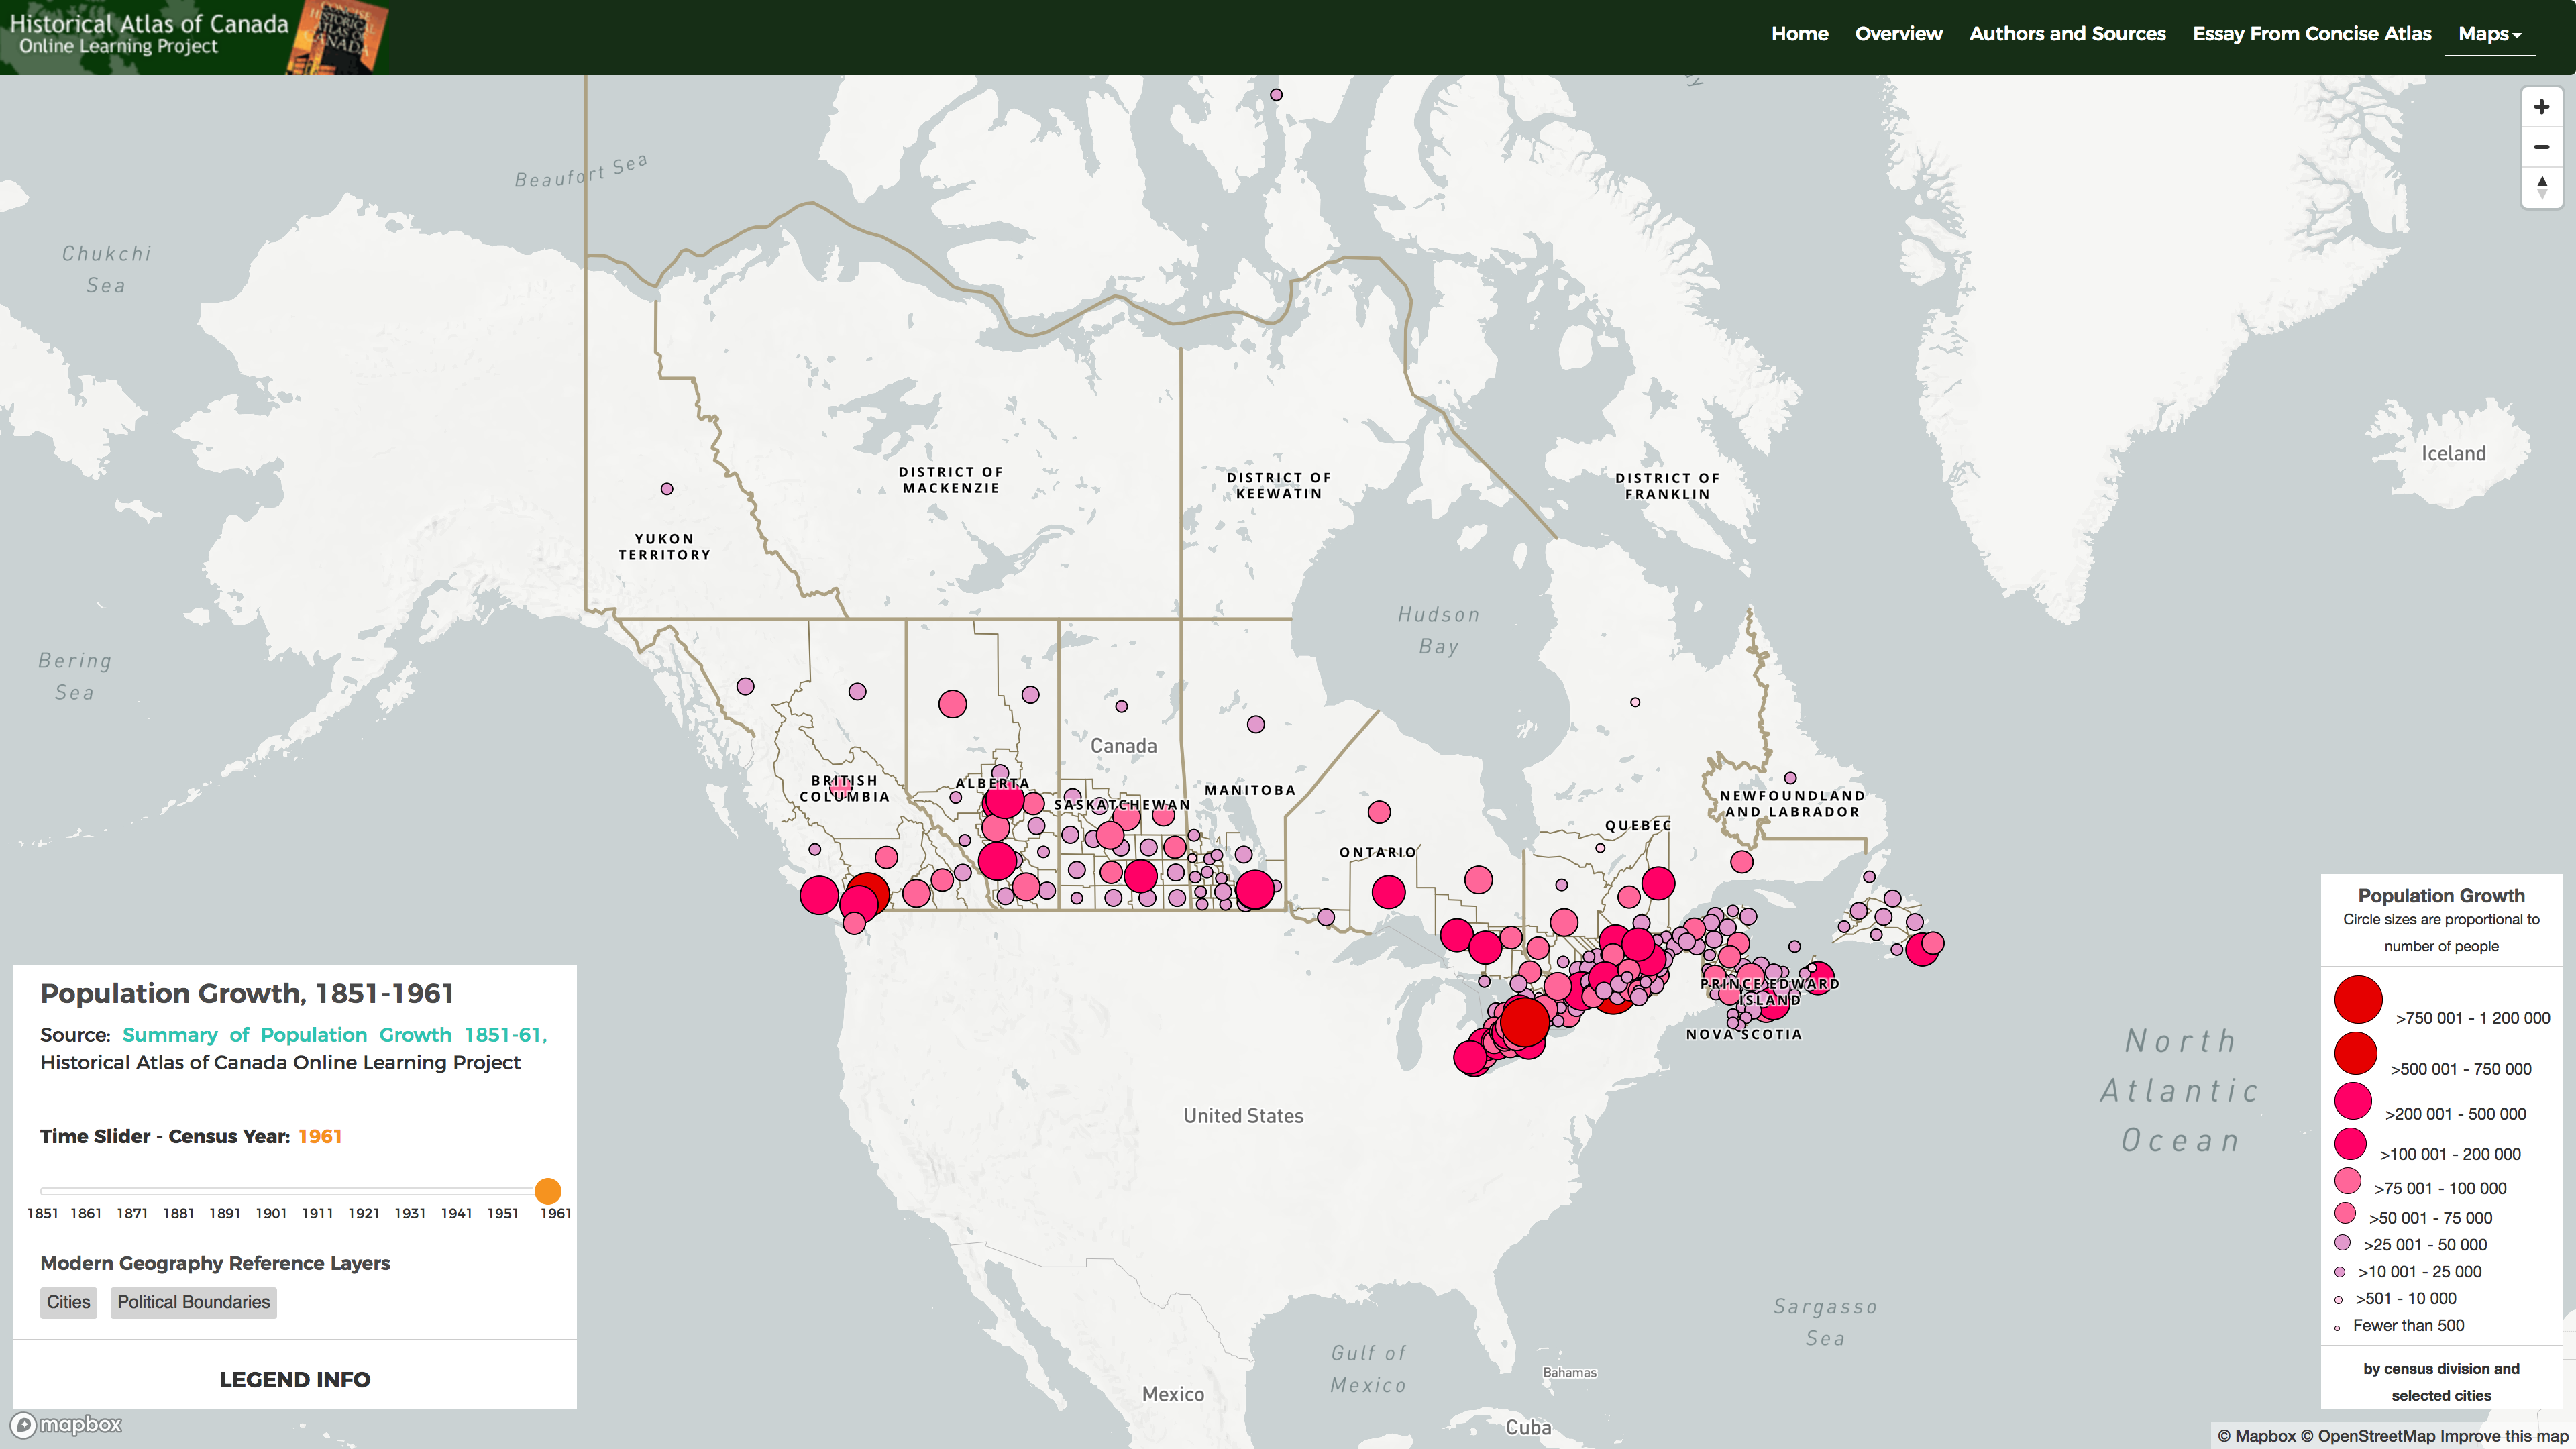
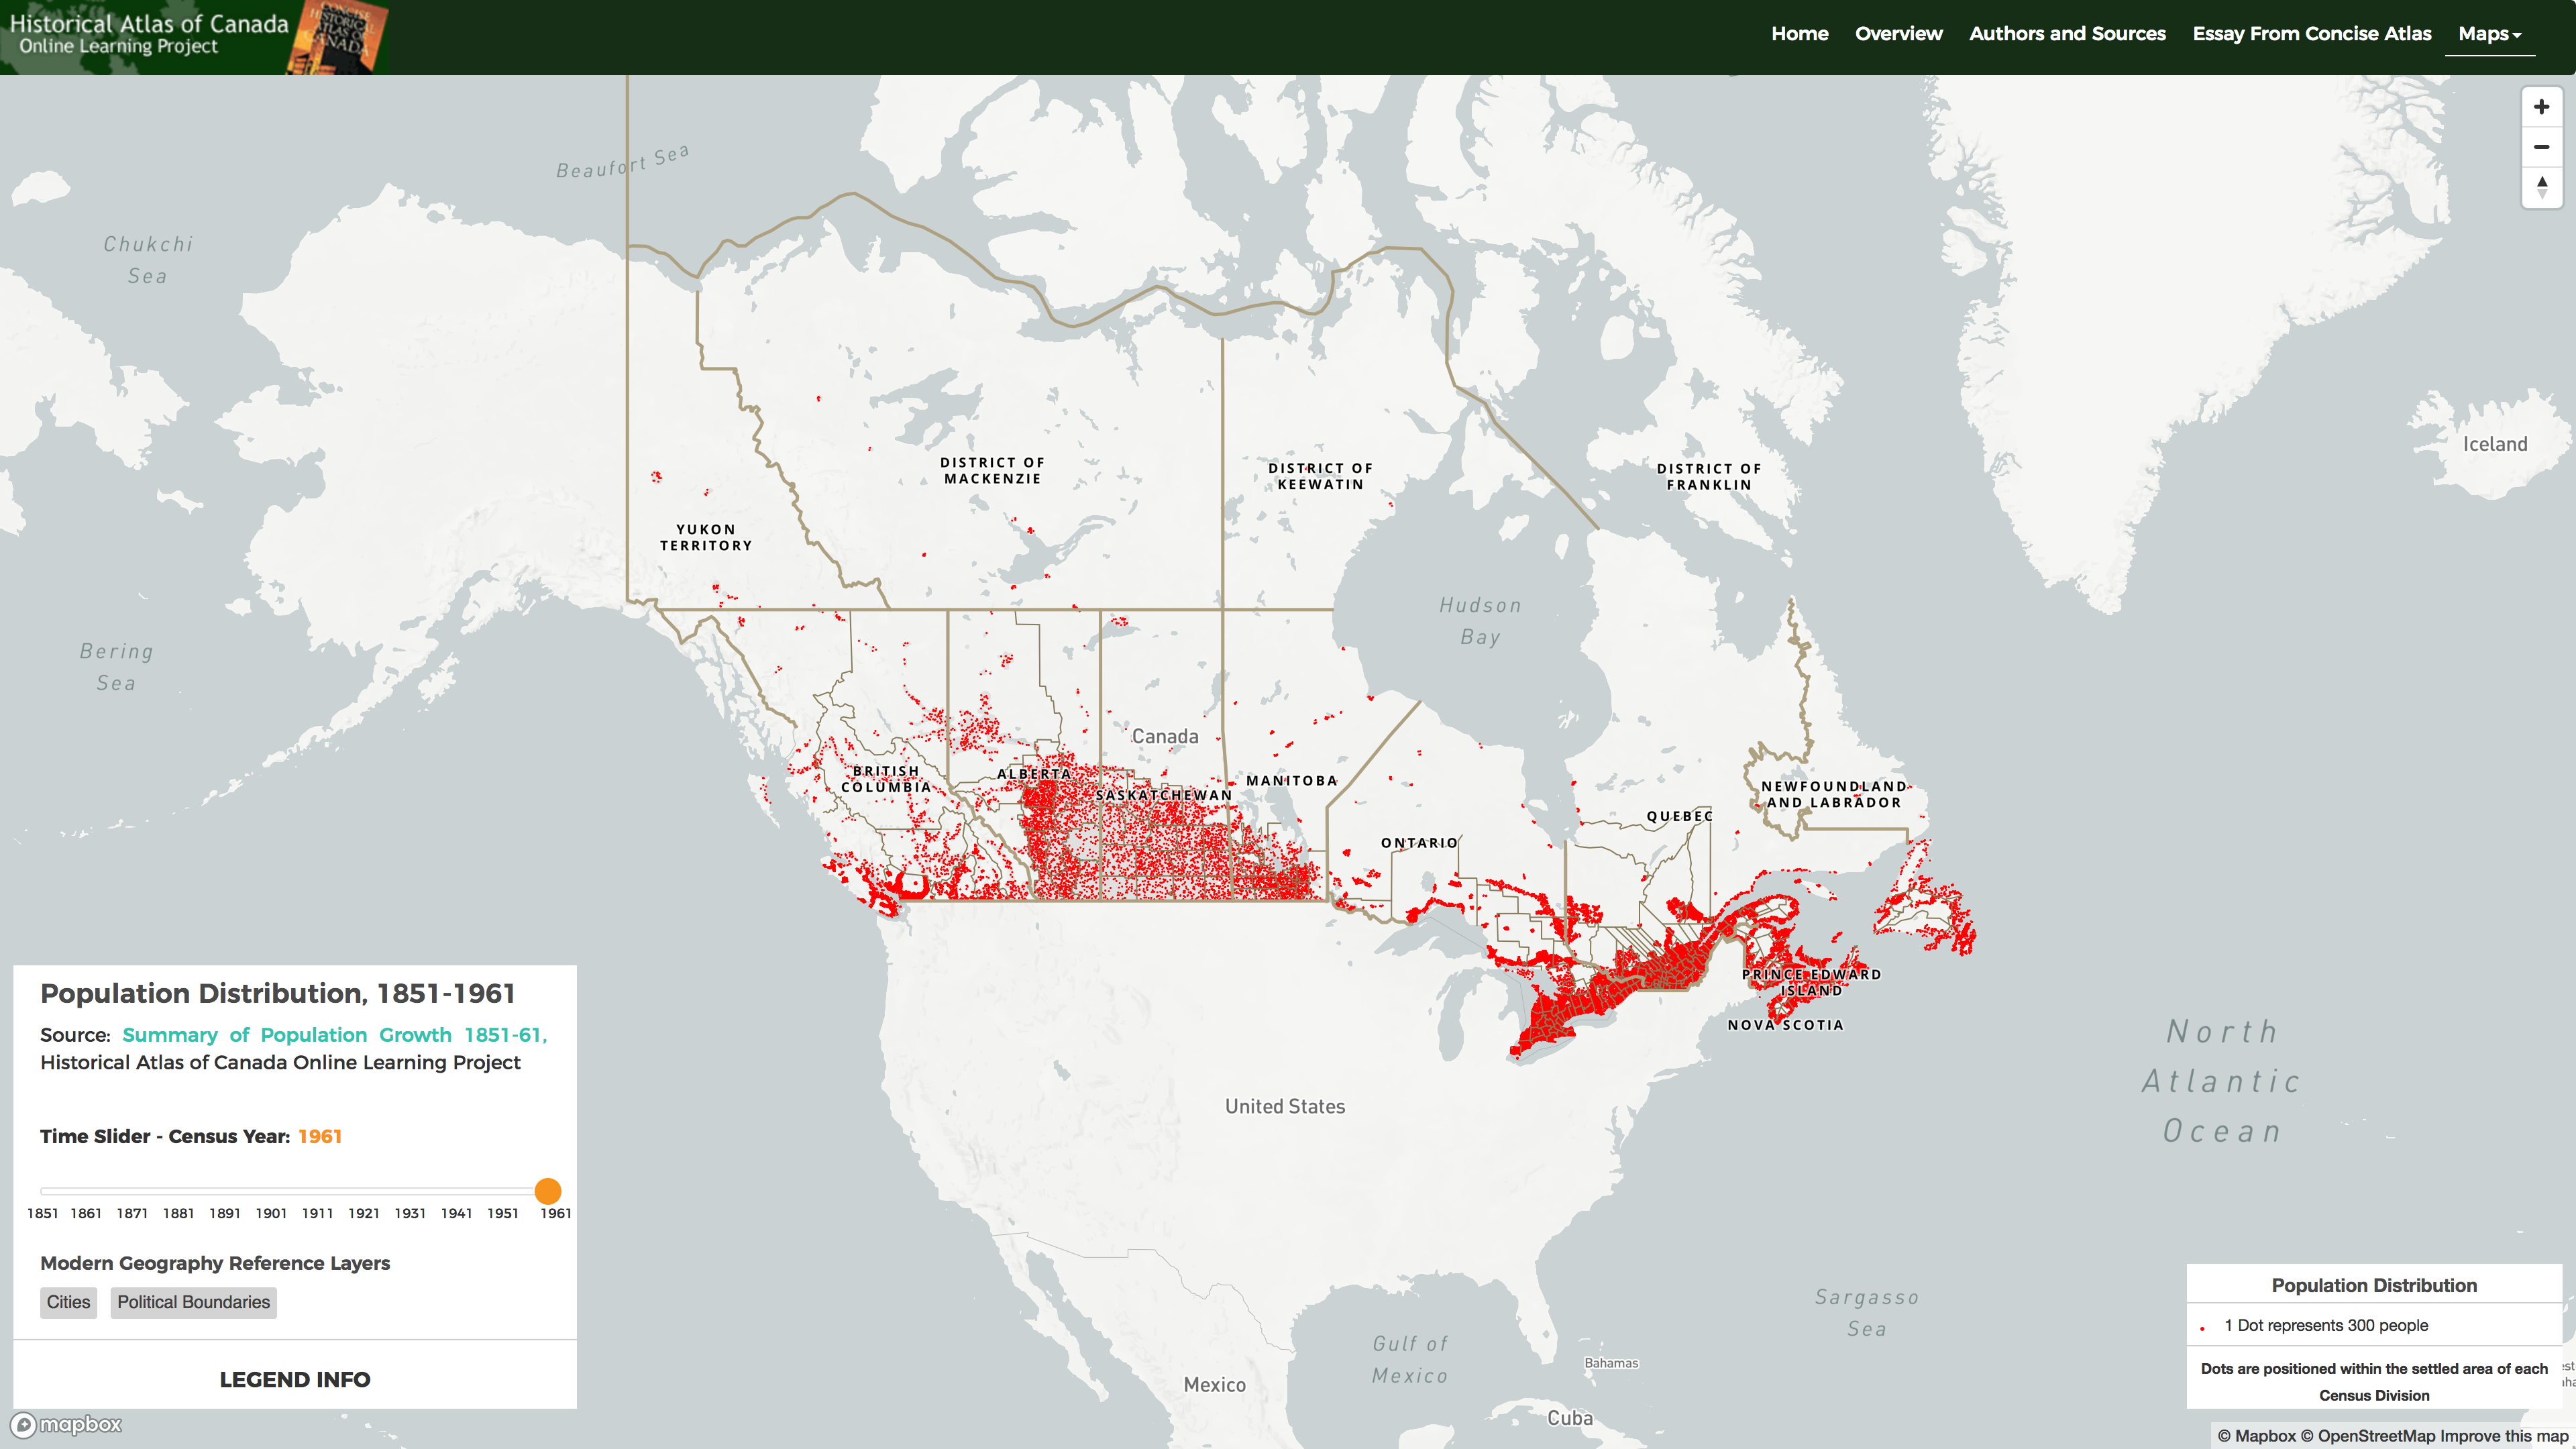
The three maps reproduce the originals: Population Density (choropleth), Population Growth (graduated circles) and Population Distribution (dot density) for 11 census years, 1851-1961 available here. They were created with ArcIMS.
Templates containing only relevant code to certain features, along with all other development files, are available on GitHub for those interested:
- Data Driven Legend Code/Live Example Hosted on GitHub
- Filtering Mapbox GL layer with jQuery Slider: Code/Live Example Hosted on GitHub
Population by Census Divisions 1851-1961 Maps
Population Density: Choropleth Map
Animated Population Density 1851-1961, Maratime Provinces Map
Population Growth: Graduated Symbols Map
Animated Population Growth 1851-1961, Maratime Provinces Map
Population Distribution: Dot Density Map
Animated Population Distribution 1851-1961, Maratime Provinces Map