Toronto 2006 Dot Density
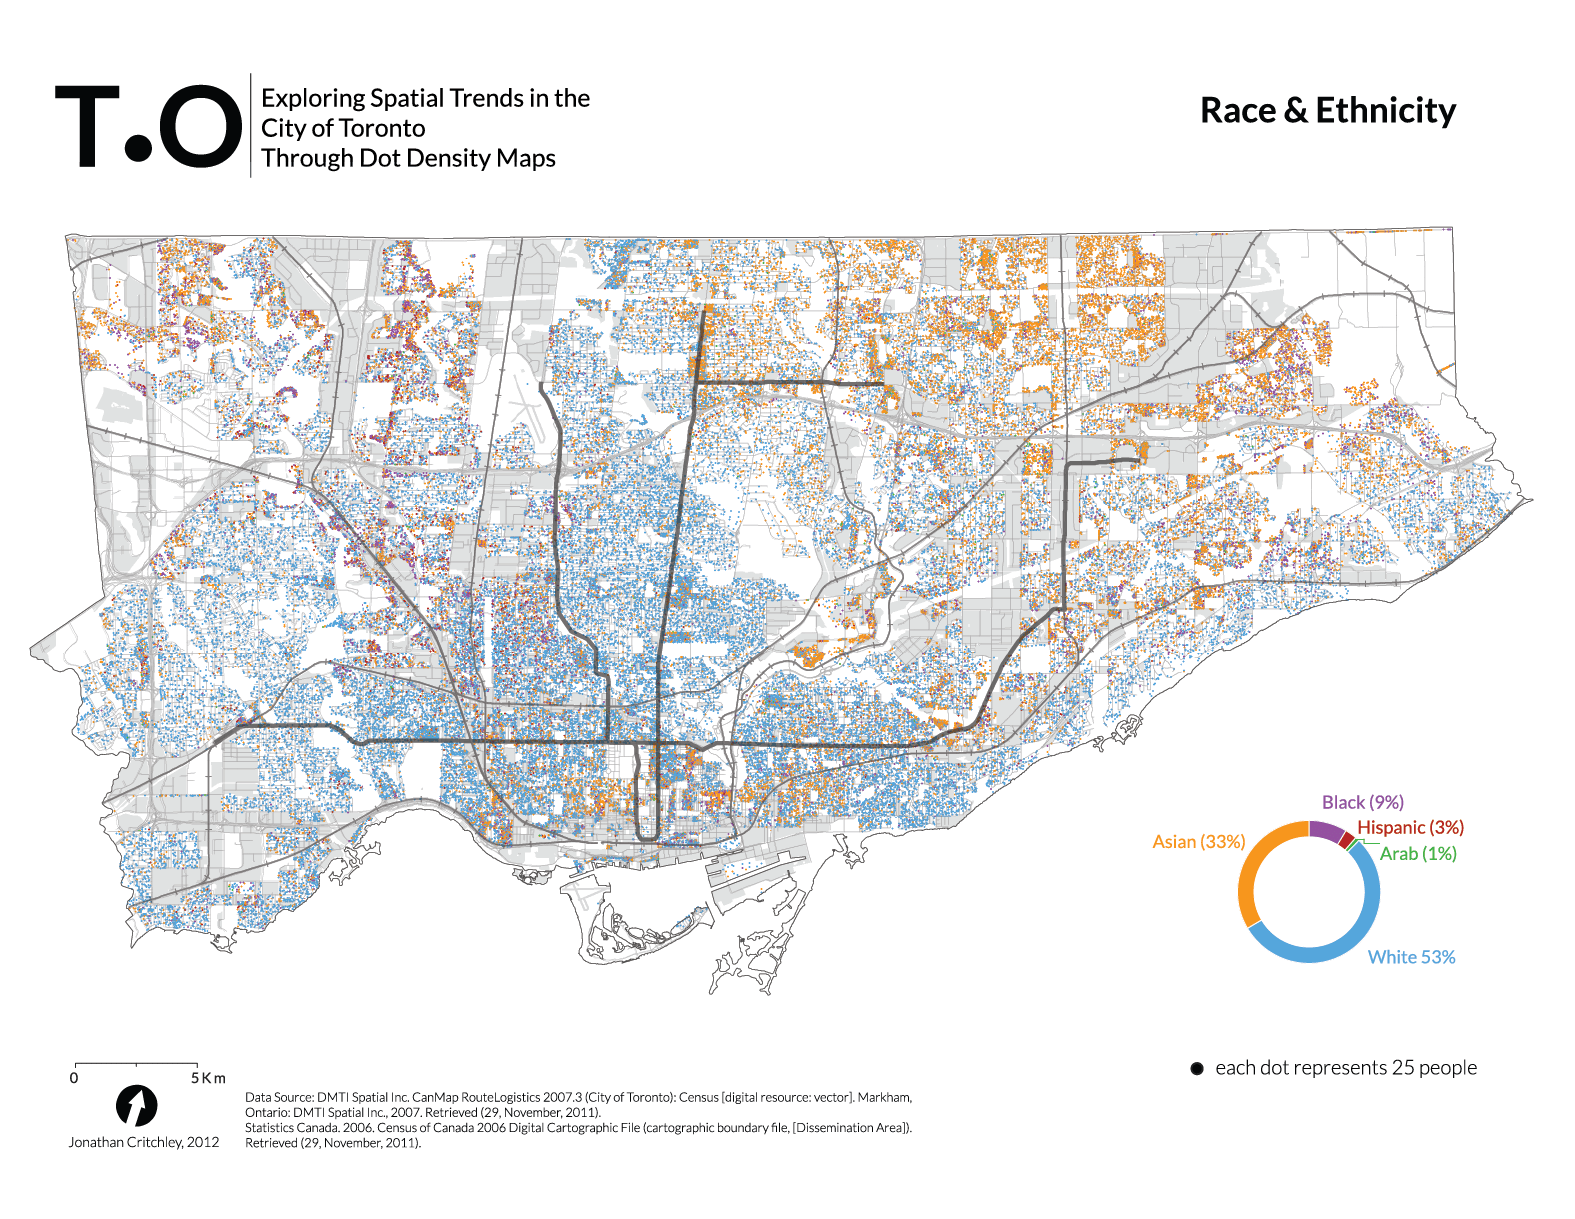
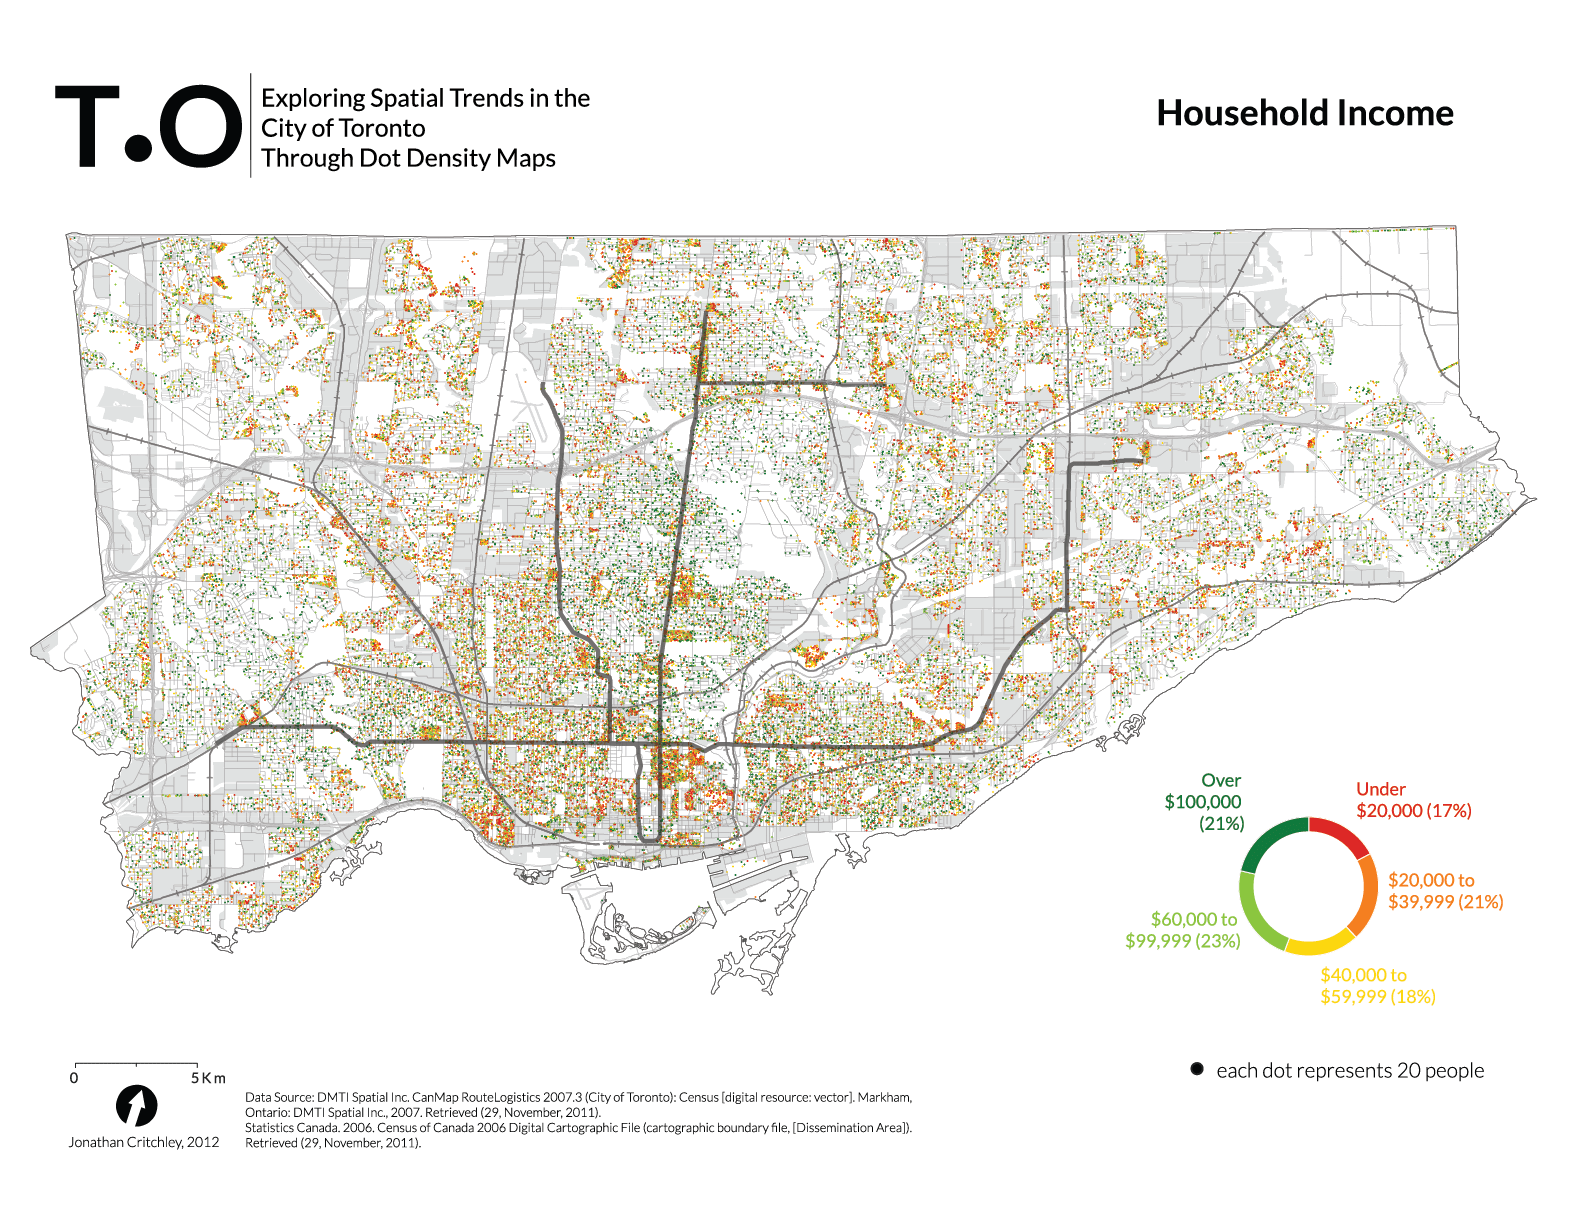
The following maps were created for the Master of Spatial Analysis cartography course final assingment. Dissemination Area data from the 2006 Canadian Census of the Population were used, and dots located on areas identified as residential land use. Toronto Transit Commission subway routes and GO Transit rail tracks are included for use as reference points and for identifying influence on local population characteristics and distribution.
As previously demonstrated by Bill Rankin and Eric Fischer, dot density maps can be used to help explore census variables without boundaries. These dot dentistry maps visualize multivariate demographic data, allowing for an improve understanding of the spatial distribution and underlying population characteristics of Toronto, Ontario, Canada. The maps explore three diverse themes with the same result: household income, primary mode of transportation to work, and race and ethnicity.
The identification of spatial trends in the data is not limited by restrictions imposed by mapping homogenous groups using distinct boundaries. Rather, the maps facilitate the identification of areas with clustering, diversity and isolation.