Toronto Ward Boundary Review
As part of my work on the Toronto Ward Boundary Review Project at the Canadian Urban Institute, the following maps, posters and web map were created for the Ward Boundary Review Final Report, released May 2016. The Maps were laid out and styled in ESRI ArcMap, with custom legends created in Adobe Illustrator. The interactive web map was created using the Mapbox service.
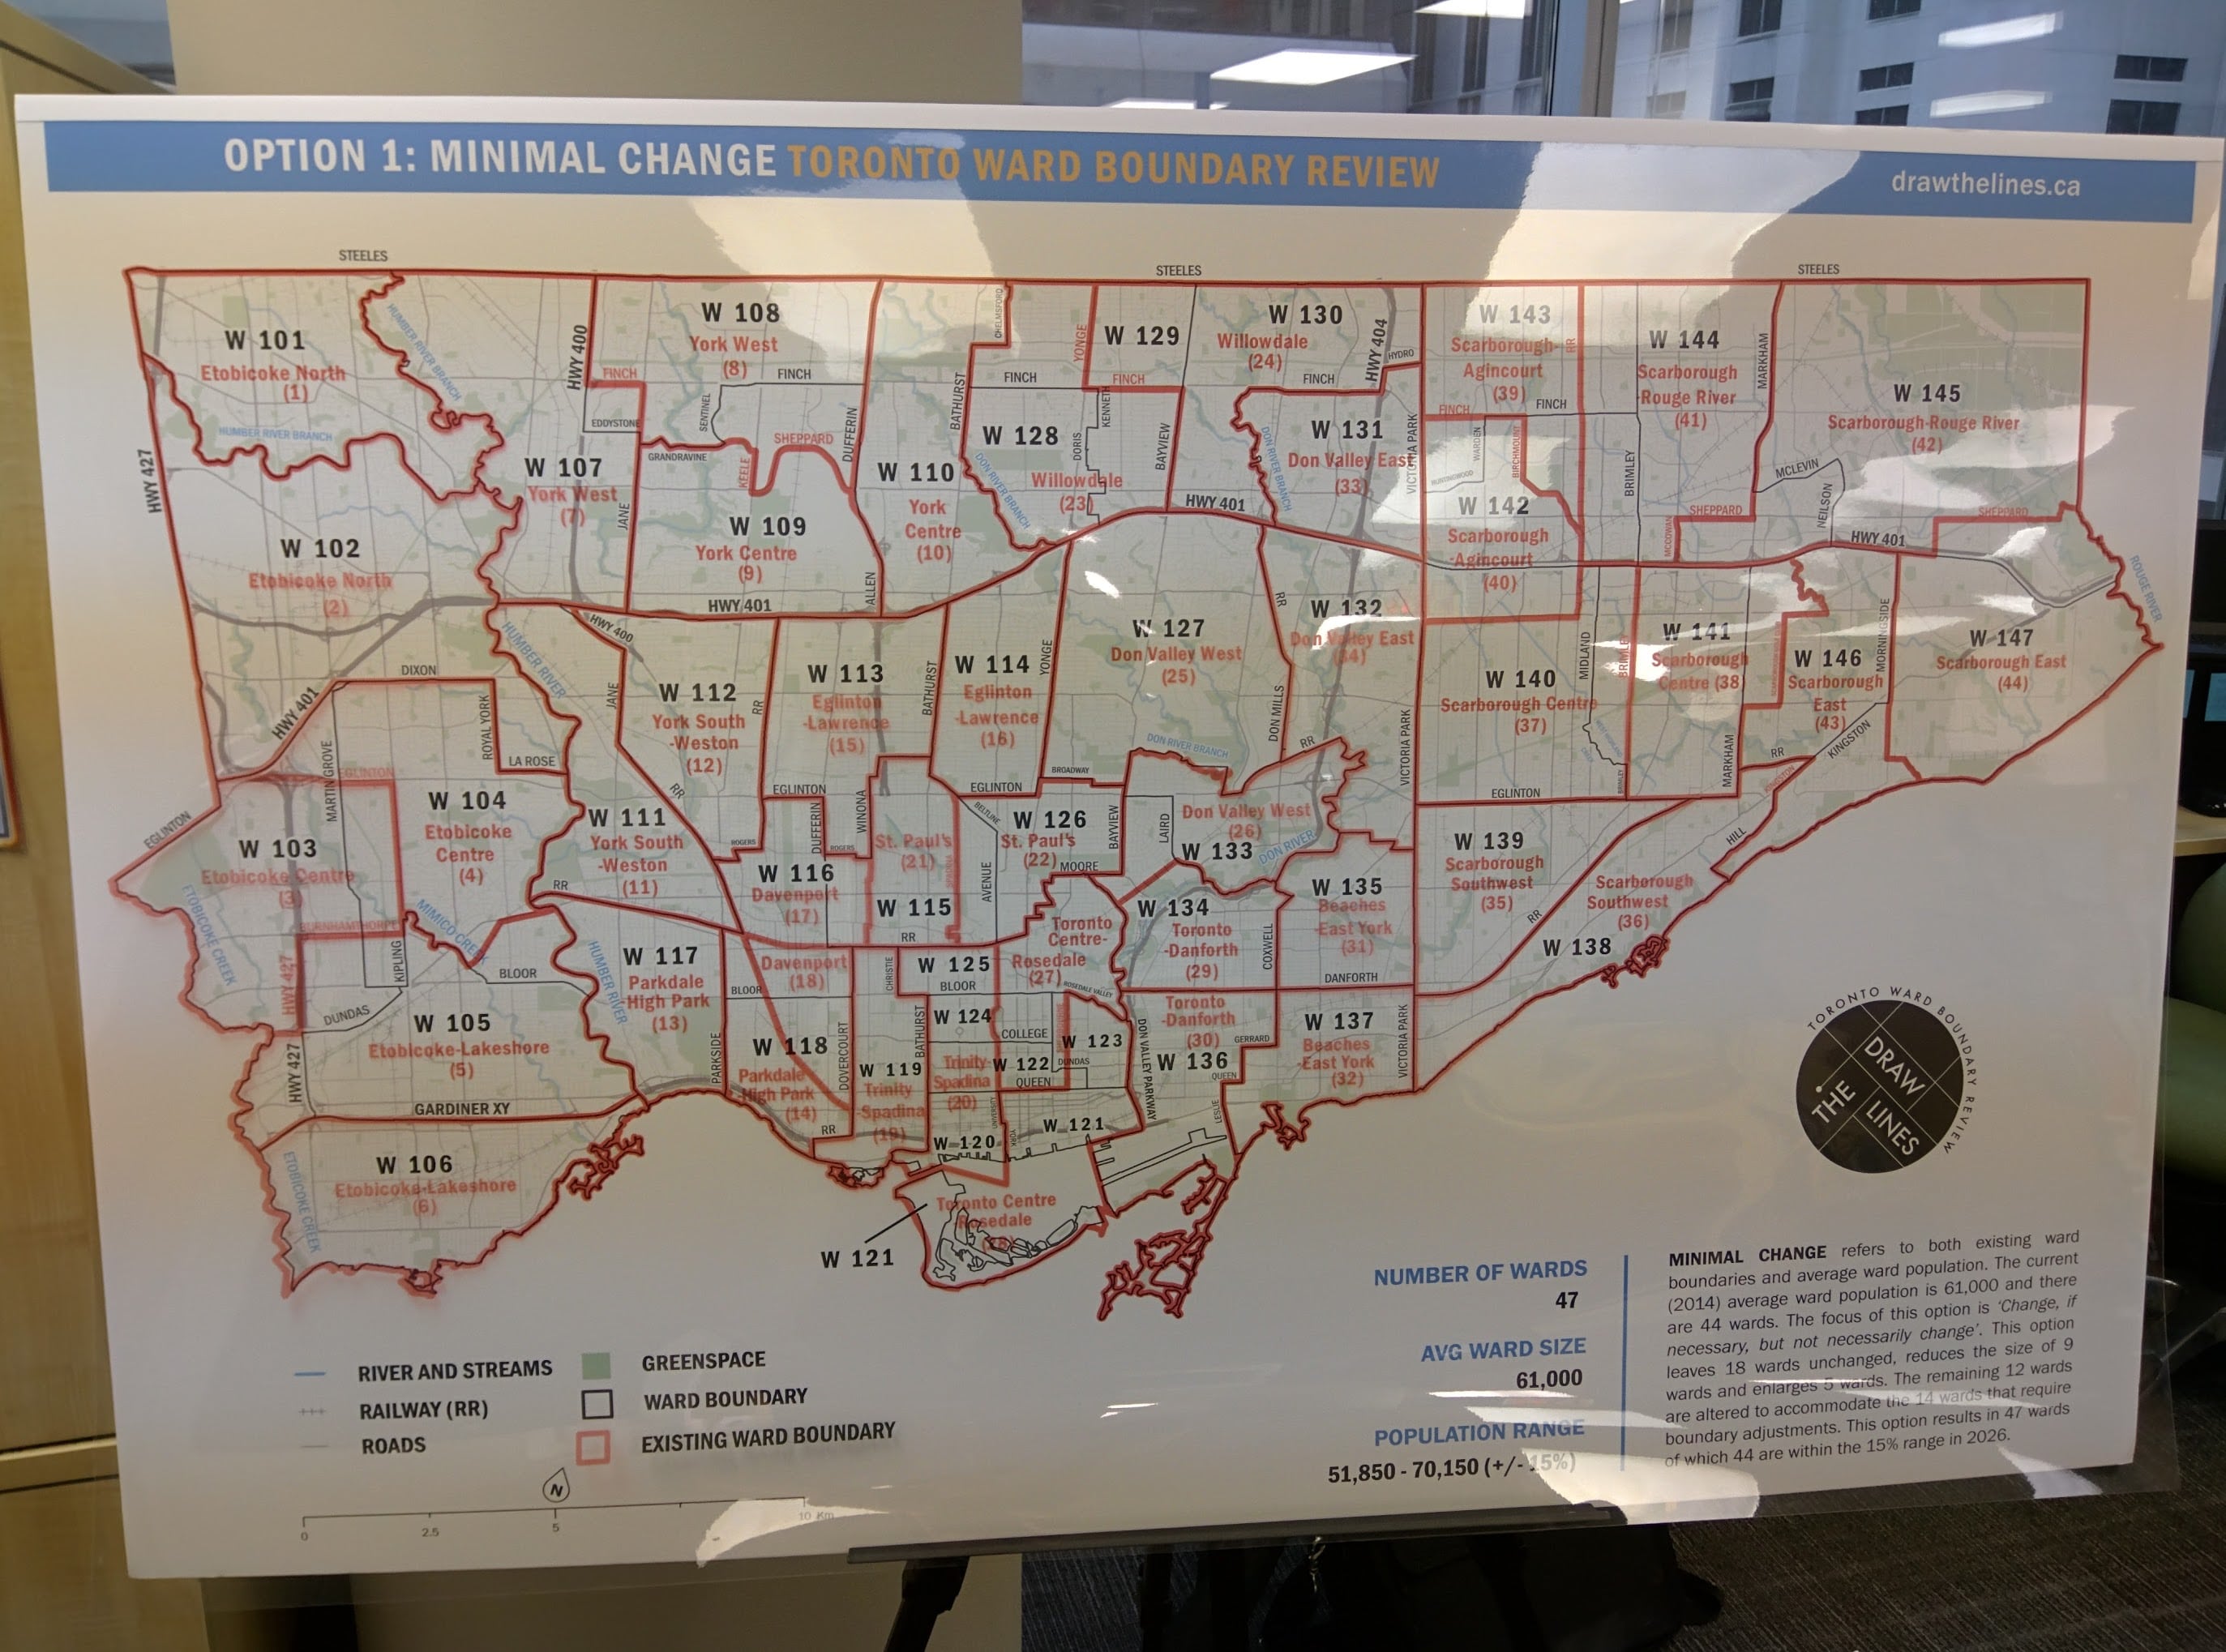
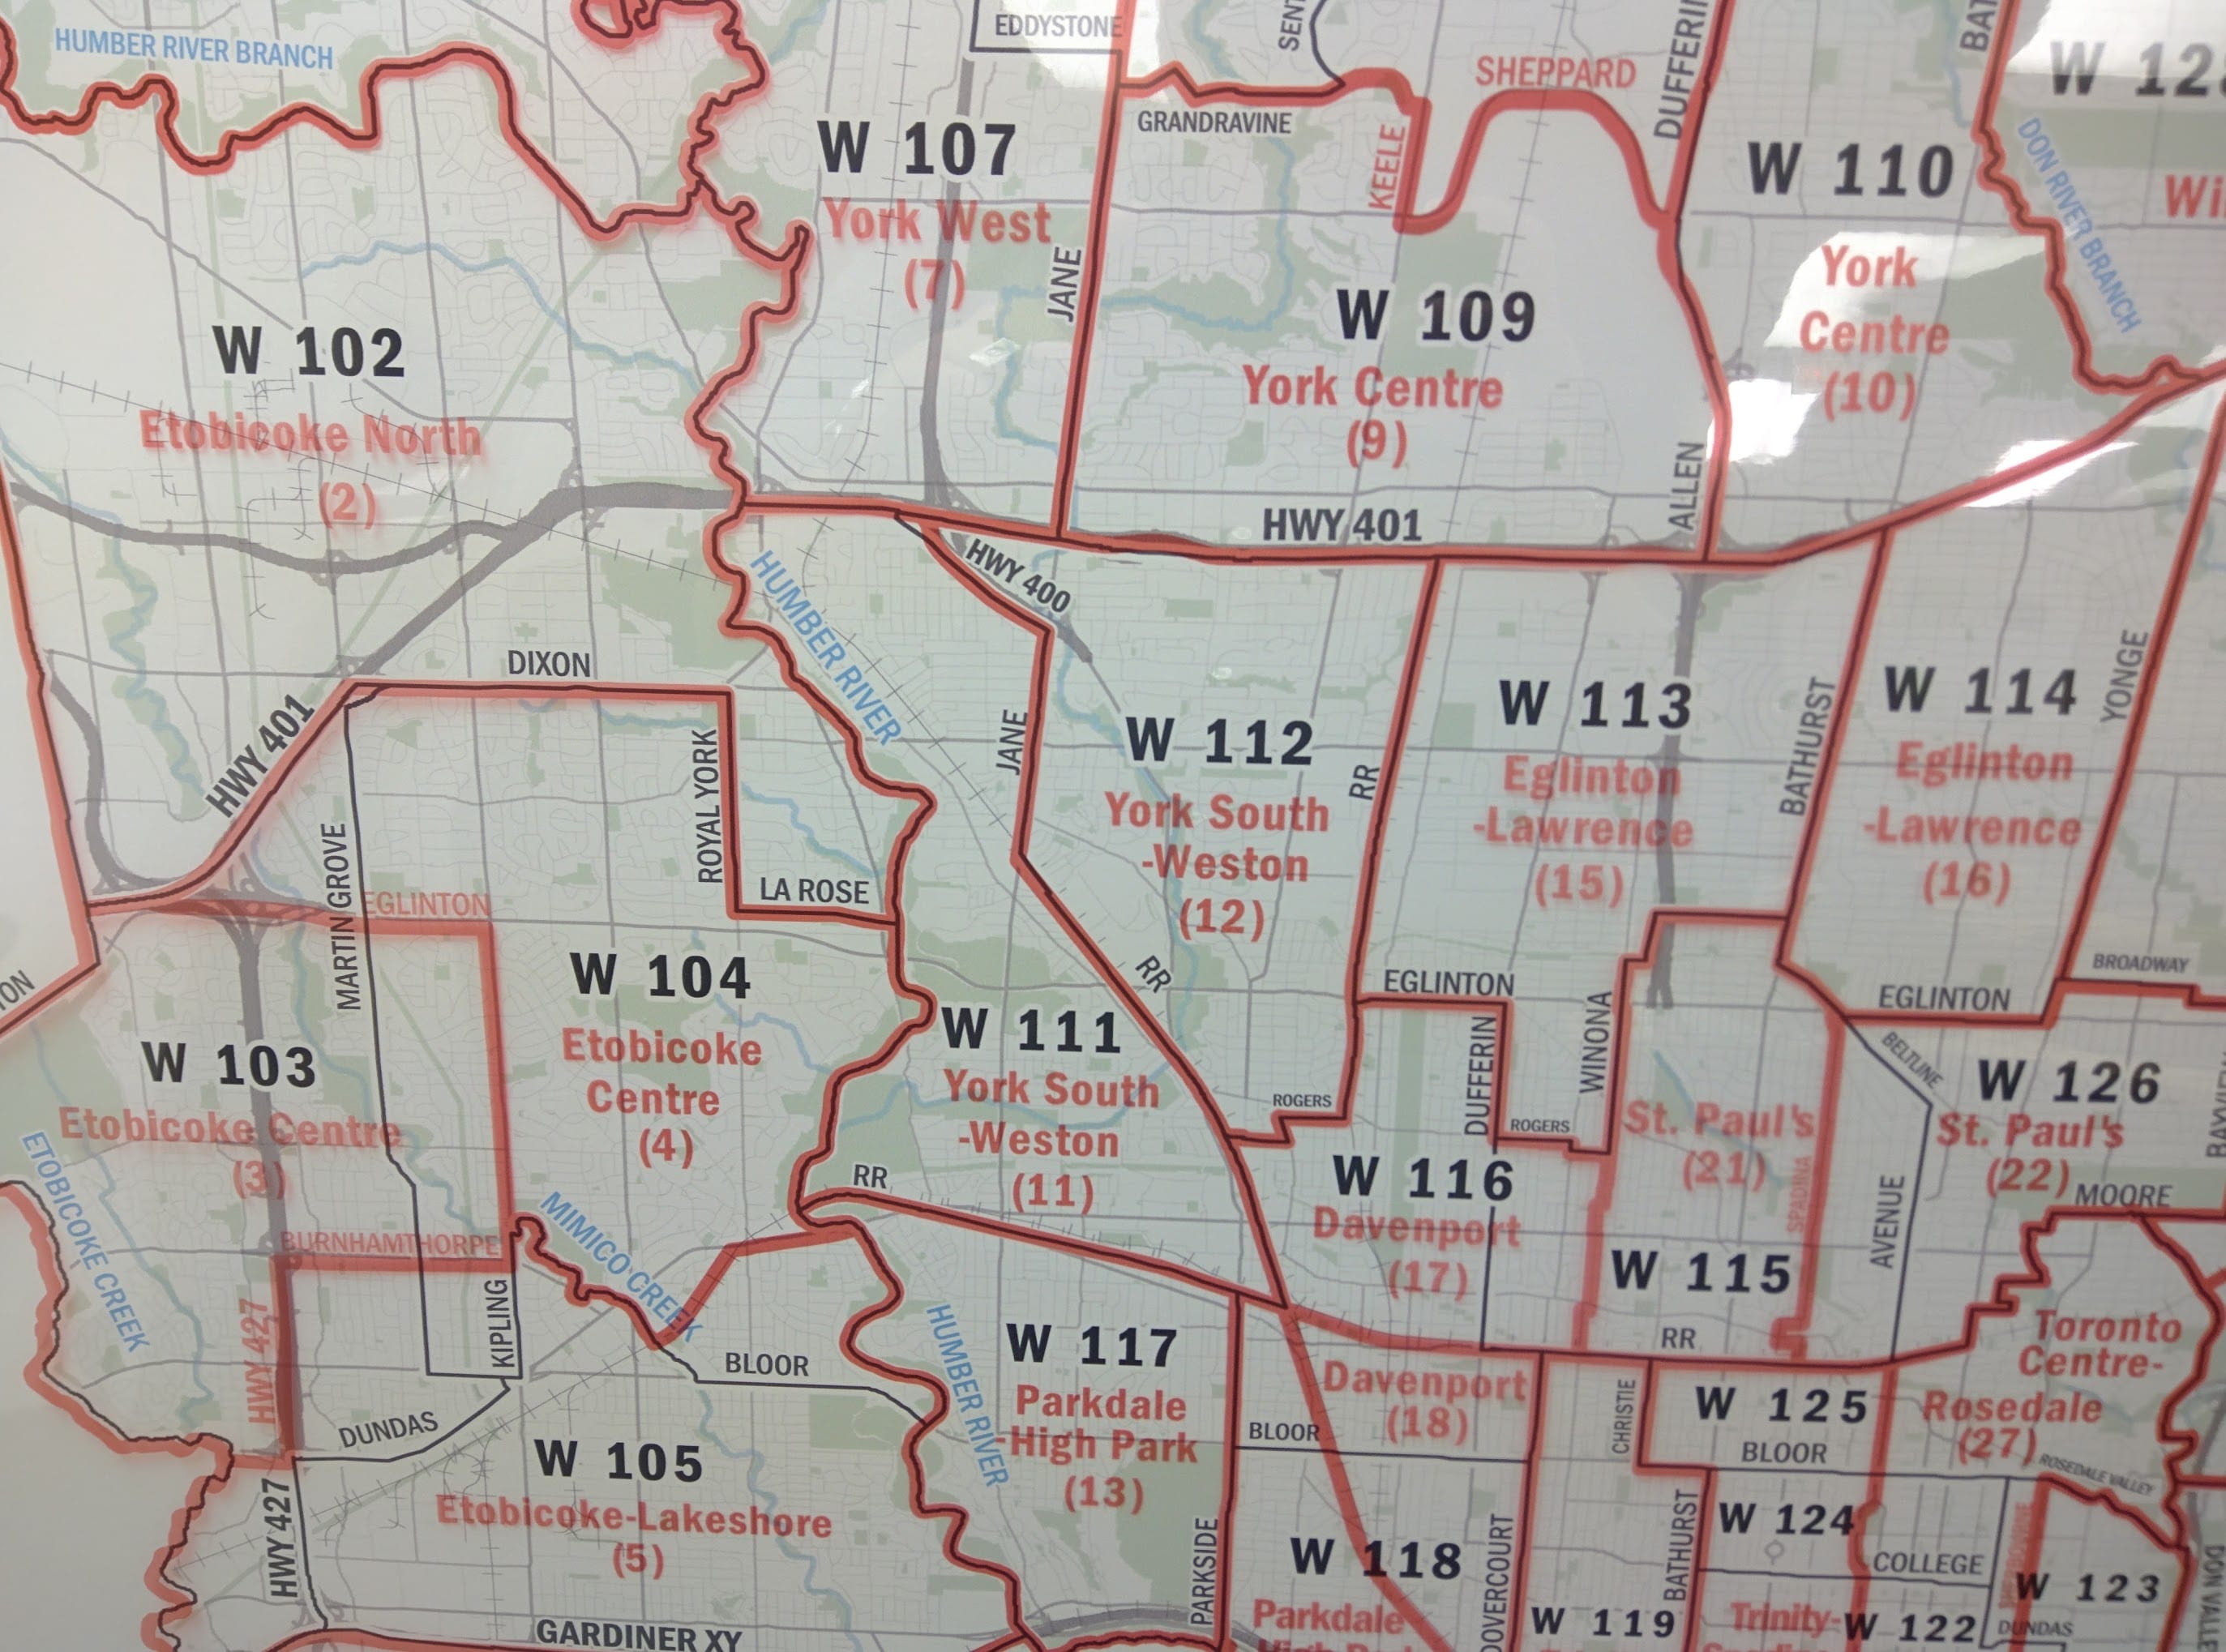
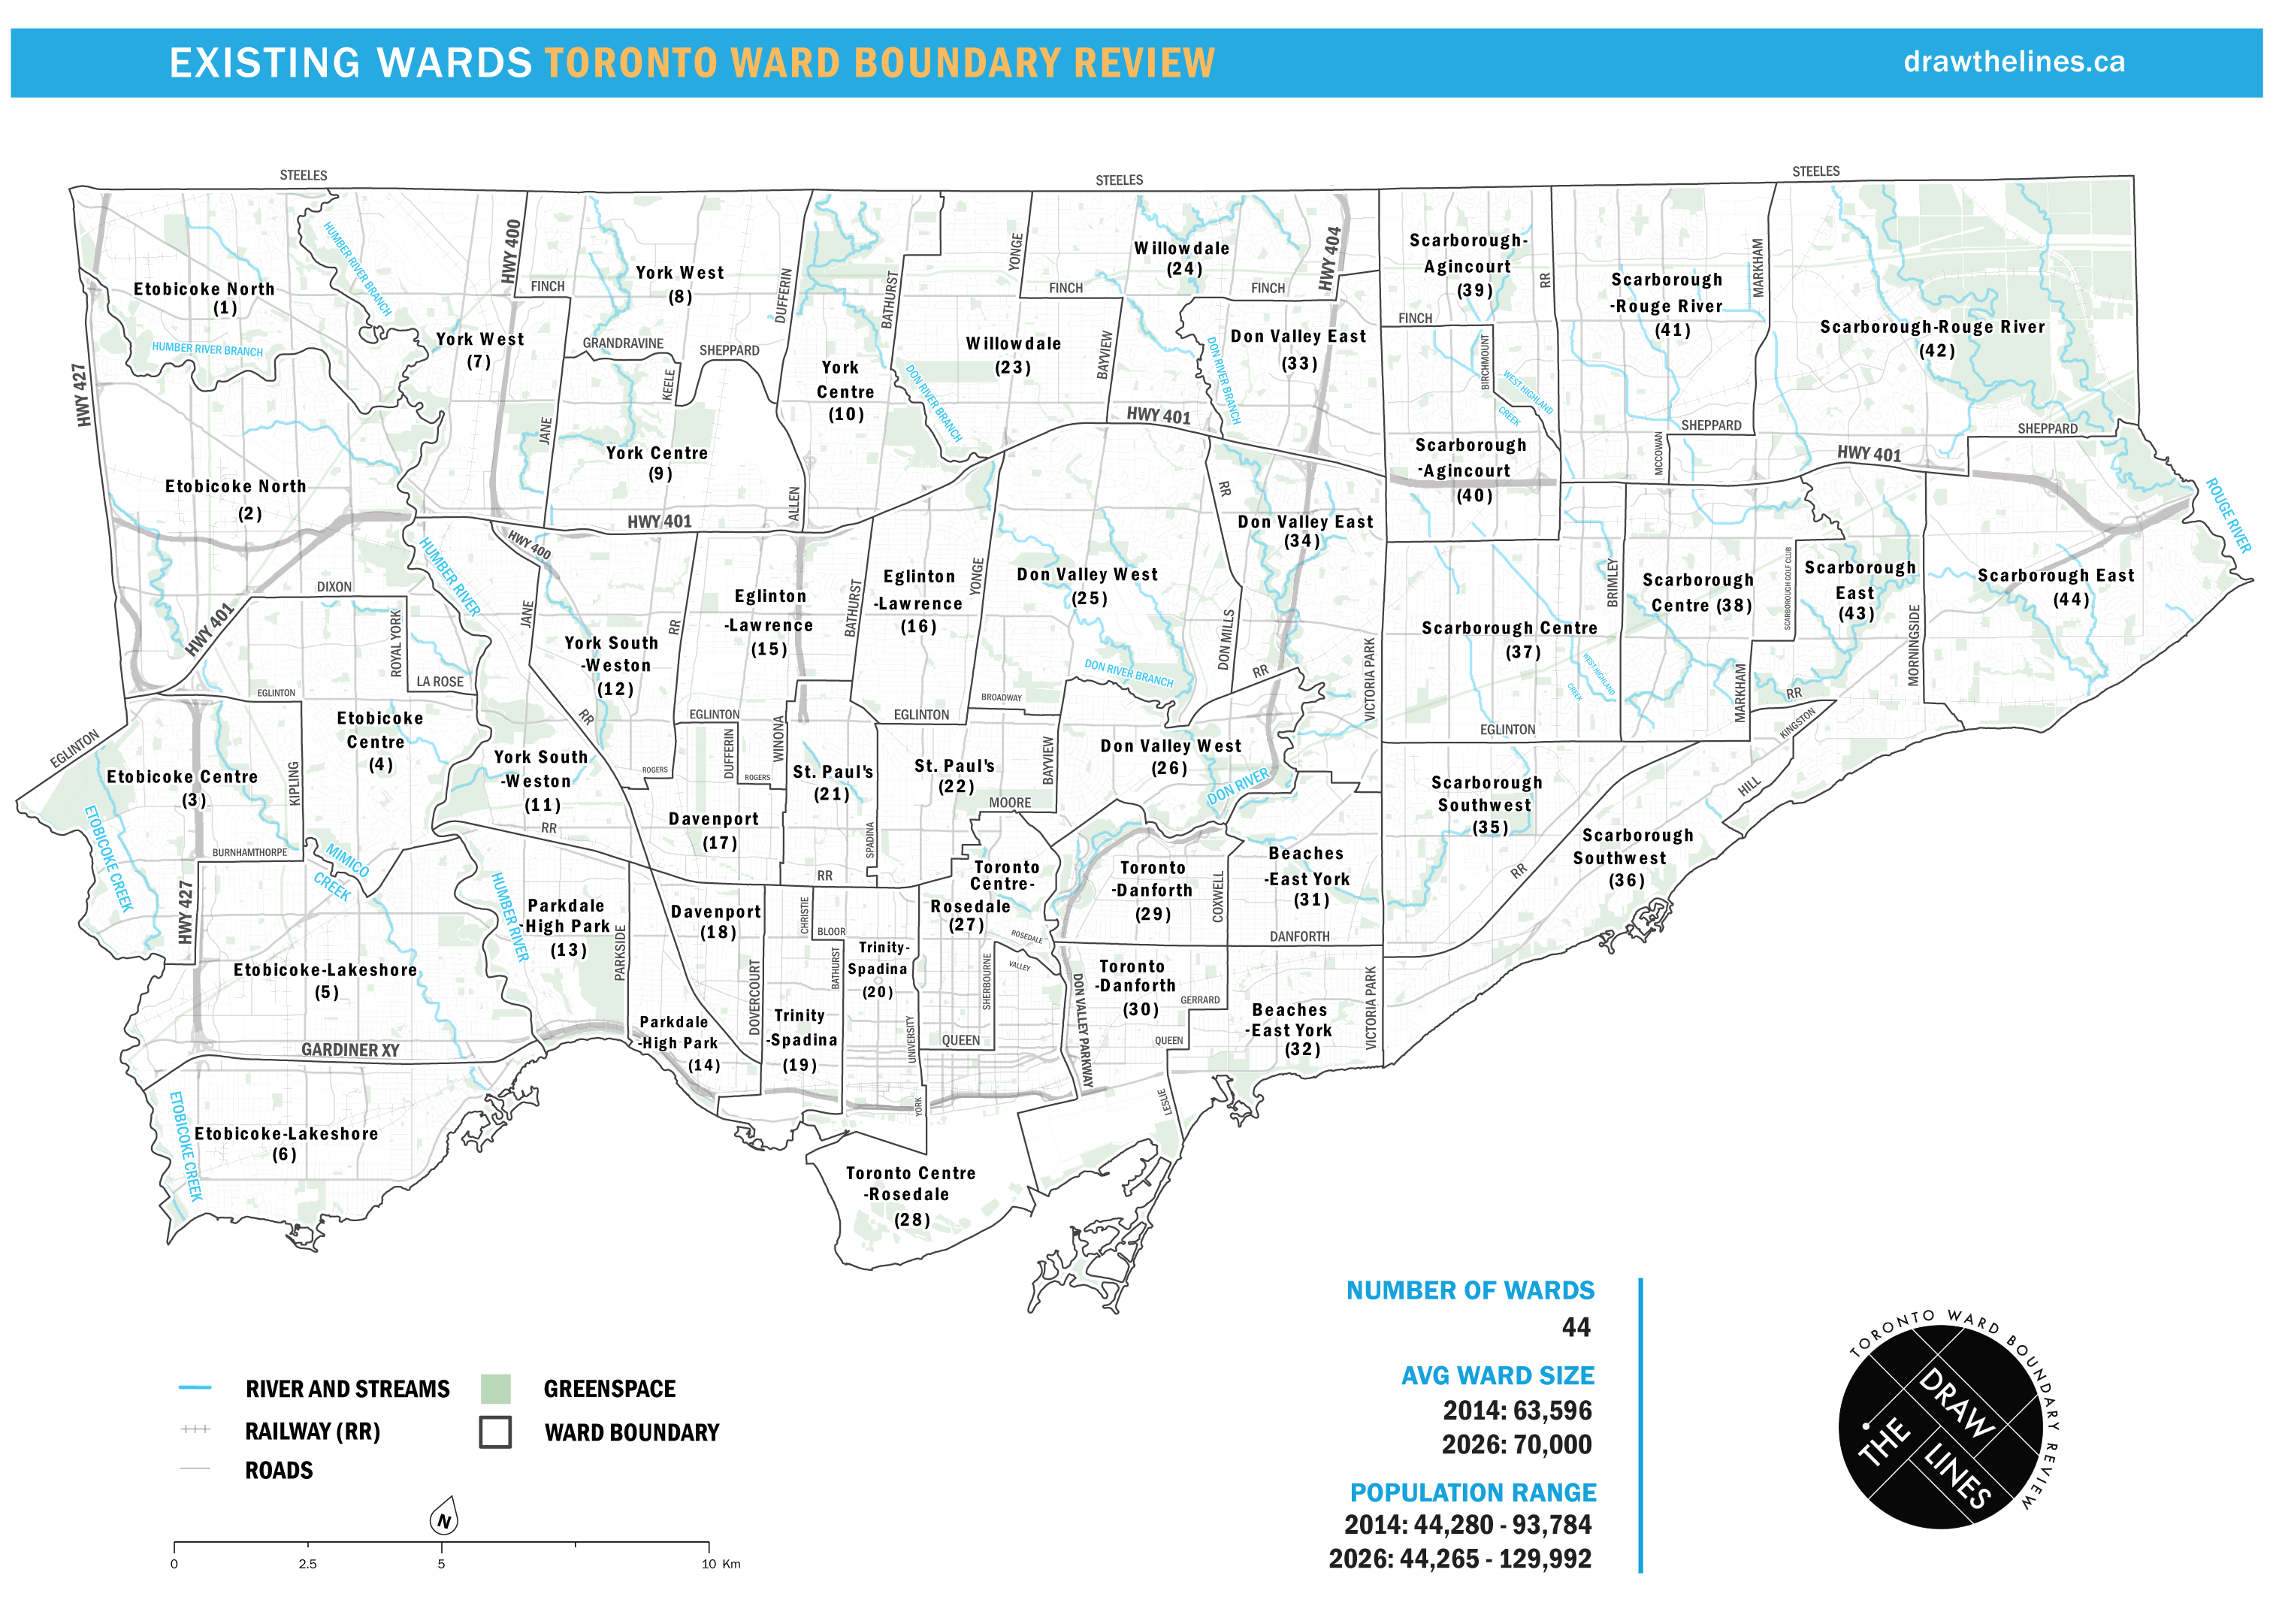
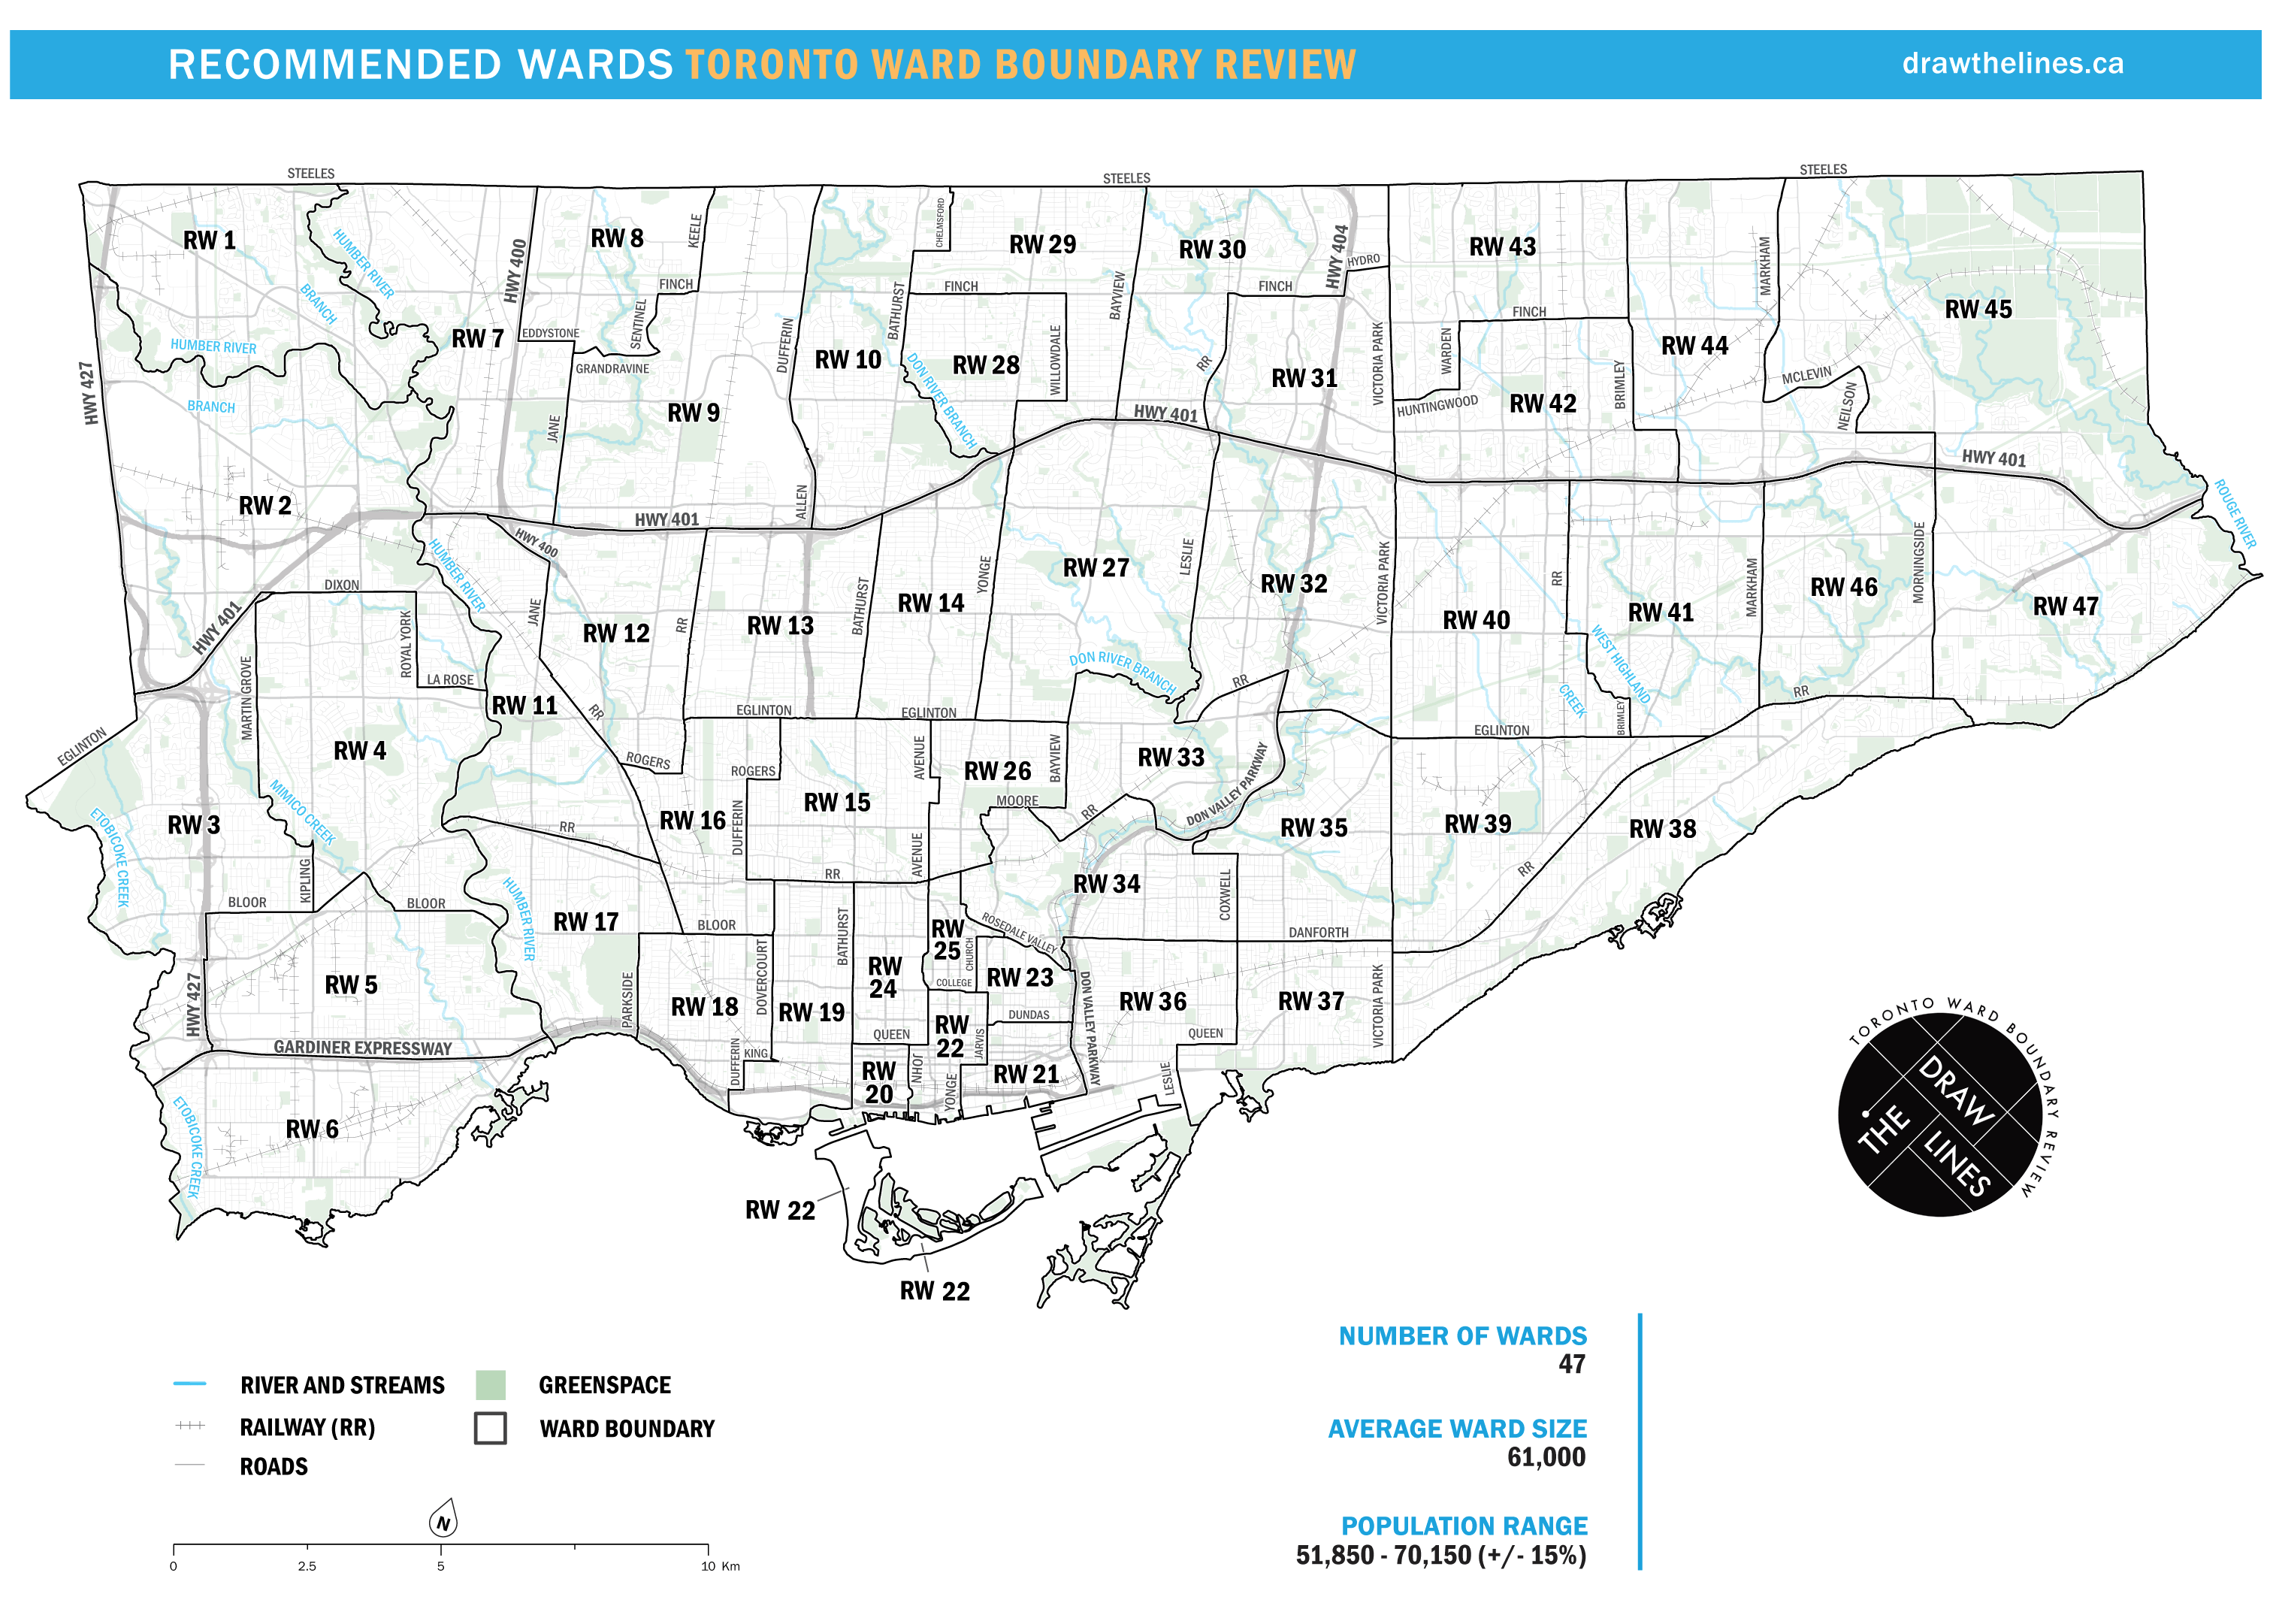
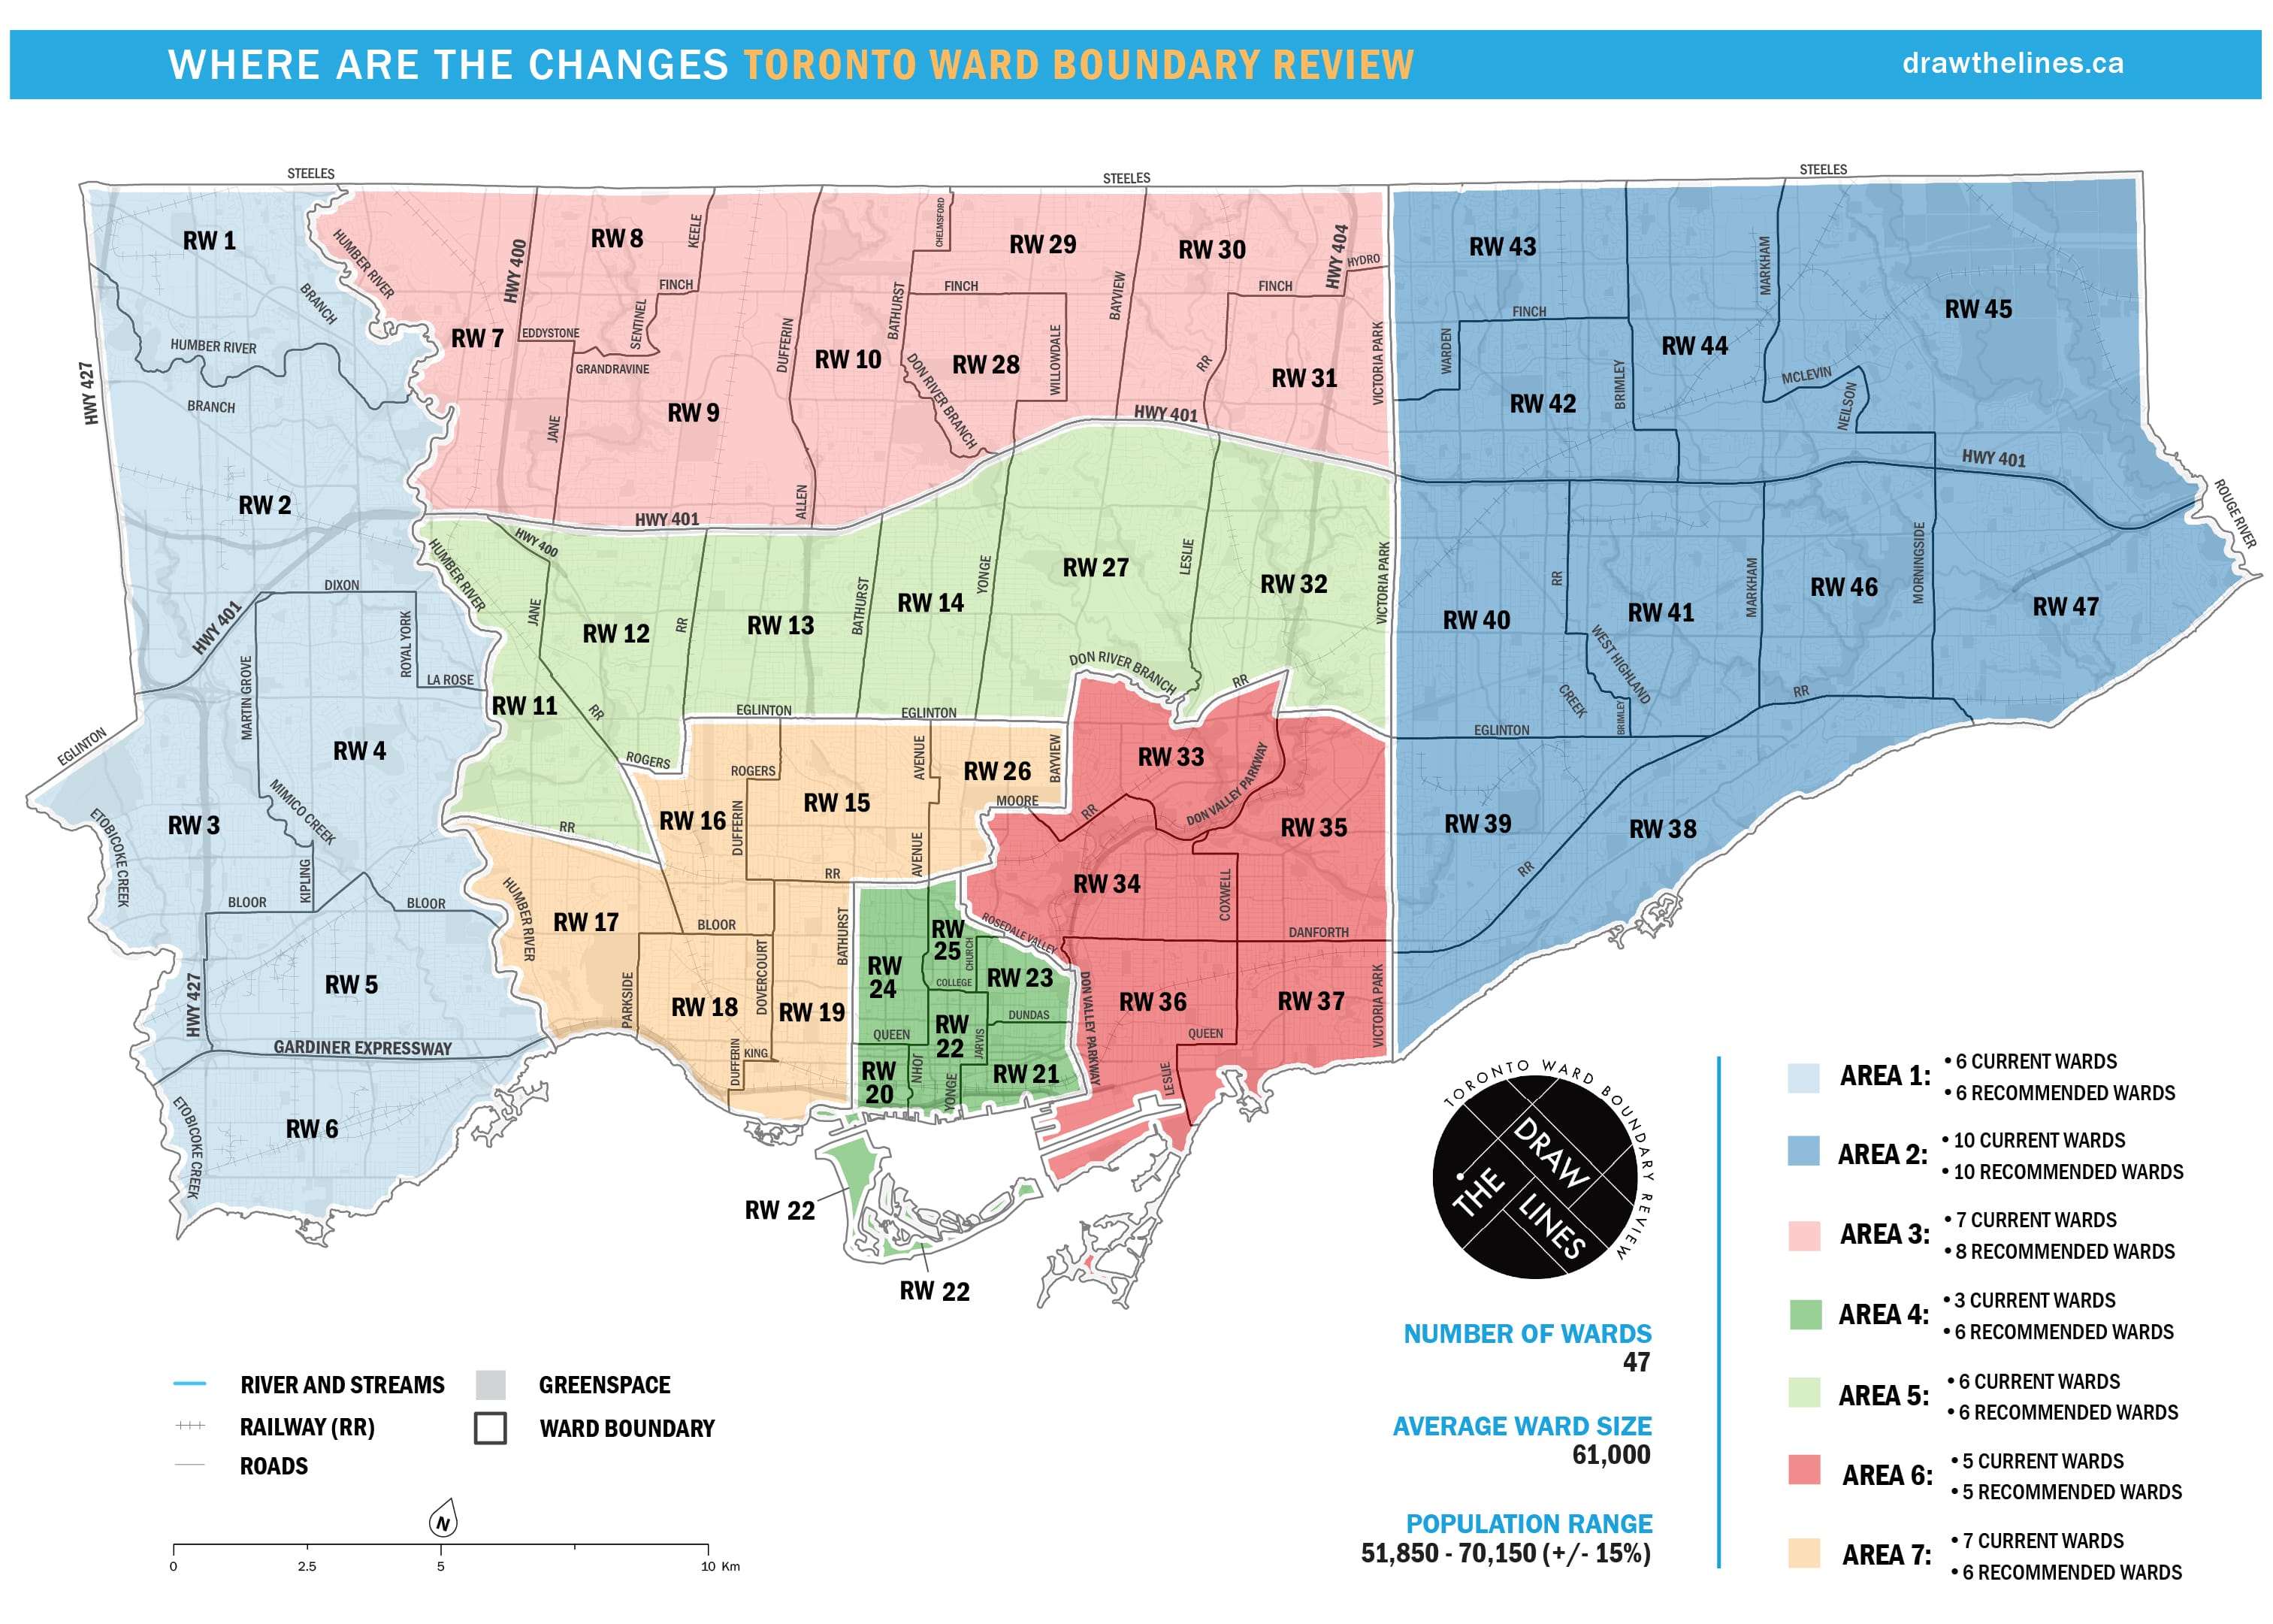
The Final Report presented a recommendation for a new ward structure consisting of 47 wards that achieves the principle of effective representation, which can be implemented for the 2018 municipal election and will last until the 2030 municipal election. A combination of physical and digital maps played an important role in presenting the location of the proposed wards boundary changes, helping to communicate the exact extents of proposed new boundaries. Printing maps at various sizes required a scalable template.
Large size physical poster maps were printed for use in public engagements sessions. They consisted of printed color maps for each of the boundary options in combination with a clear overlay of existing ward boundary structure that could be laid on top for use in comparing and contrasting differences.
An interactive web map was also created allowing users to explore the proposed boundaries, allowing them to zoom in and out, and turn on and off boundary layers to see how they differ from each other.
These tools allowed the public and decision makers to view and assess how the different options would change the current ward structure.
Maps
Posters